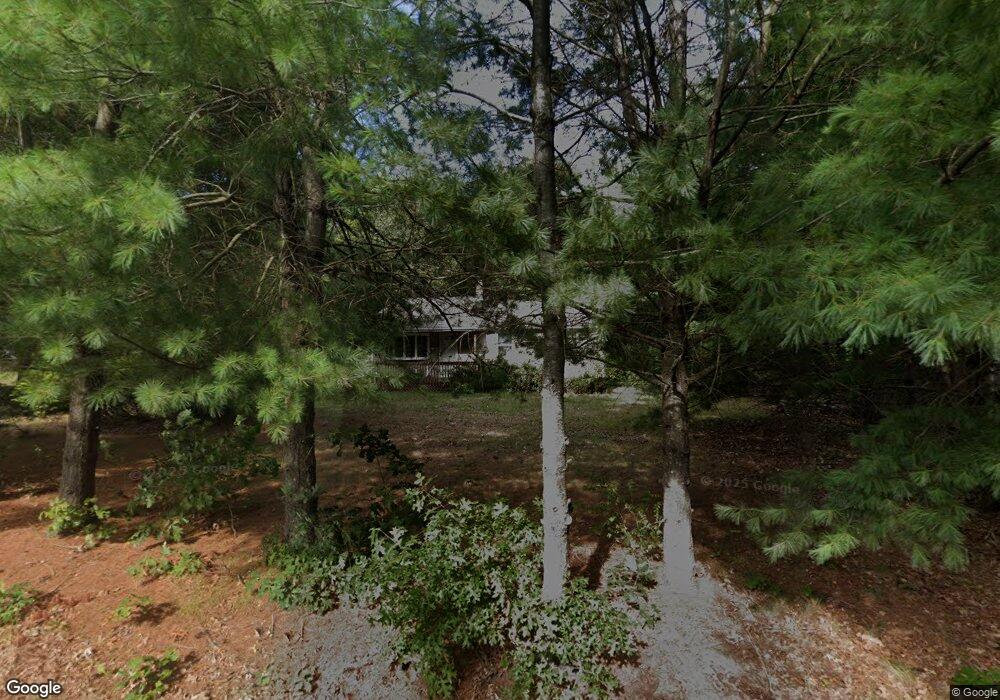
3 Forrest St Berkley, MA 02779
Estimated Value: $464,870 - $519,000
About This Home
This home is located at 3 Forrest St, Berkley, MA 02779 and is currently estimated at $497,468, approximately $196 per square foot. 3 Forrest St is a home located in Bristol County with nearby schools including Berkley Community School and Our Lady of Lourdes School.
Ownership History
We collect this data history from publicly available records. To have your information removed, we recommend requesting removal directly through your county’s website.
Purchase Details
Home Financials for this Owner
Home Financials are based on the most recent Mortgage that was taken out on this home.Purchase Details
Home Financials for this Owner
Home Financials are based on the most recent Mortgage that was taken out on this home.Purchase History
We collect this data history from publicly available records. To have your information removed, we recommend requesting removal directly through your county’s website.
| Date | Buyer | Sale Price | Title Company |
|---|---|---|---|
| $600,000 | None Available | ||
| $250,000 | -- |
Mortgage History
We collect this data history from publicly available records. To have your information removed, we recommend requesting removal directly through your county’s website.
| Date | Status | Borrower | Loan Amount |
|---|---|---|---|
| Open | $480,000 | ||
| Previous Owner | $225,000 |
Tax History
We collect this data history from publicly available records. To have your information removed, we recommend requesting removal directly through your county’s website.
| Year | Tax Paid | Tax Assessment Tax Assessment Total Assessment is a certain percentage of the fair market value that is determined by local assessors to be the total taxable value of land and additions on the property. | Land | Improvement |
|---|---|---|---|---|
| 2025 | $43 | $354,600 | $145,000 | $209,600 |
| 2024 | $4,035 | $324,100 | $124,900 | $199,200 |
| 2023 | $3,999 | $302,500 | $124,900 | $177,600 |
| 2022 | $3,853 | $280,200 | $108,600 | $171,600 |
| 2021 | $3,753 | $262,800 | $103,400 | $159,400 |
| 2020 | $3,430 | $254,400 | $91,500 | $162,900 |
| 2019 | $3,177 | $246,400 | $91,500 | $154,900 |
| 2018 | $3,306 | $235,800 | $88,000 | $147,800 |
| 2017 | $3,286 | $229,800 | $98,600 | $131,200 |
| 2016 | $3,205 | $216,000 | $98,600 | $117,400 |
| 2015 | $3,030 | $217,800 | $98,600 | $119,200 |
| 2014 | $2,916 | $227,600 | $107,000 | $120,600 |
Map
- 22 Country Ln
- 44 S Main St
- 658 Berkley St
- 2 Lima Ln
- 51 Bryant St
- 548 R Berkley St
- 31 Swing Dr
- 1020 Somerset Ave Unit 15
- 133 S Main St
- 1 Elm St
- 2 Elm St
- 1721-1731 Somerset Ave
- 1592 Elm St
- 300 Country Hill Dr
- 7 Parsons Walk
- 440 Old Somerset Ave
- 121 Bayview Ave
- 2165 Pleasant St
- 1337 Karen Rd
- 382 Main St
Ask me questions while you tour the home.