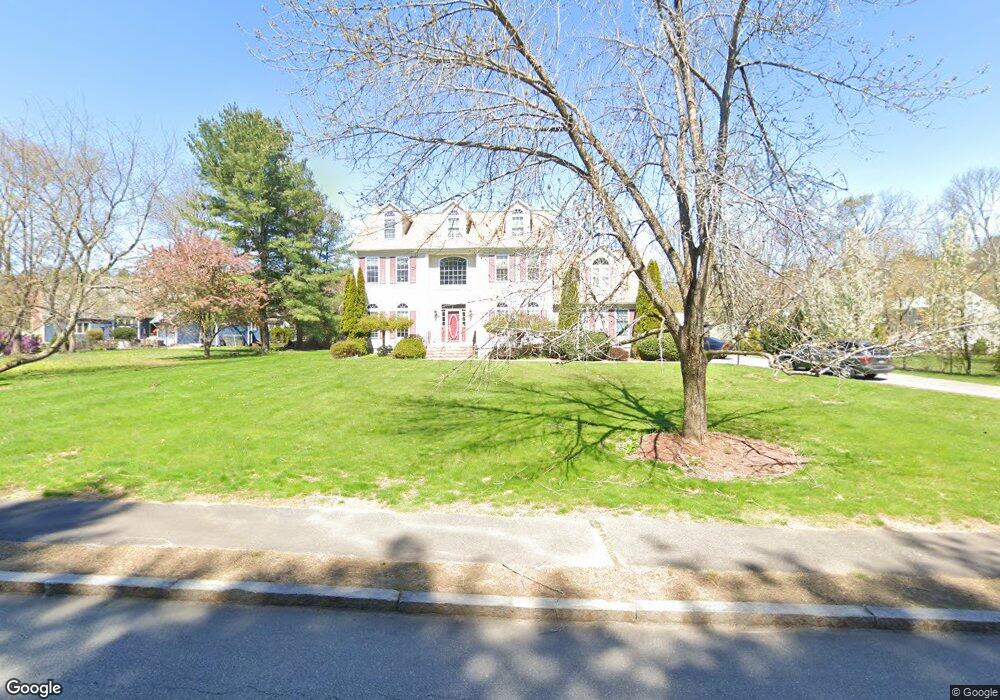
3 Garvey Rd Framingham, MA 01701
Nobscot NeighborhoodEstimated Value: $1,136,000 - $1,258,000
About This Home
This home is located at 3 Garvey Rd, Framingham, MA 01701 and is currently estimated at $1,218,597, approximately $350 per square foot. 3 Garvey Rd is a home located in Middlesex County with nearby schools including Framingham High School, Sudbury Valley School, and MetroWest Jewish Day School.
Ownership History
We collect this data history from publicly available records. To have your information removed, we recommend requesting removal directly through your county’s website.
Purchase Details
Purchase Details
Purchase Details
Purchase Details
Home Financials for this Owner
Home Financials are based on the most recent Mortgage that was taken out on this home.Home Values in the Area
Average Home Value in this Area
Purchase History
We collect this data history from publicly available records. To have your information removed, we recommend requesting removal directly through your county’s website.
| Date | Buyer | Sale Price | Title Company |
|---|---|---|---|
| $1,100,000 | -- | ||
| -- | None Available | ||
| -- | -- | ||
| -- | -- |
Mortgage History
We collect this data history from publicly available records. To have your information removed, we recommend requesting removal directly through your county’s website.
| Date | Status | Borrower | Loan Amount |
|---|---|---|---|
| Closed | $542,000 | ||
| Closed | $9,000 | ||
| Closed | $469,000 | ||
| Previous Owner | $440,000 | ||
| Previous Owner | $400,000 |
Tax History
We collect this data history from publicly available records. To have your information removed, we recommend requesting removal directly through your county’s website.
| Year | Tax Paid | Tax Assessment Tax Assessment Total Assessment is a certain percentage of the fair market value that is determined by local assessors to be the total taxable value of land and additions on the property. | Land | Improvement |
|---|---|---|---|---|
| 2025 | $13,929 | $1,166,600 | $344,200 | $822,400 |
| 2024 | $13,596 | $1,091,200 | $306,300 | $784,900 |
| 2023 | $13,248 | $1,012,100 | $282,400 | $729,700 |
| 2022 | $12,788 | $930,700 | $256,700 | $674,000 |
| 2021 | $12,378 | $881,000 | $246,600 | $634,400 |
| 2020 | $12,636 | $843,500 | $224,200 | $619,300 |
| 2019 | $12,393 | $805,800 | $213,700 | $592,100 |
| 2018 | $12,411 | $760,500 | $209,300 | $551,200 |
| 2017 | $12,284 | $735,100 | $202,800 | $532,300 |
| 2016 | $12,394 | $713,100 | $210,700 | $502,400 |
| 2015 | $11,993 | $673,000 | $210,700 | $462,300 |
Map
- 301 Winch St
- 15 Carter Dr
- 1059 Grove St
- 140 Winch St
- 620 Edmands Rd
- 50 Juniper Ln
- 1207 Windsor Dr
- 1711 Windsor Dr Unit 1711
- 46 Country Farm Rd
- 21 Country Farm Rd Unit 21
- 32 Hawk Ln Unit 48
- 1083 Edgell Rd
- 55 Country Farm Rd
- 616 Grove St
- 576 Grove St
- 2 Whiting Rd
- 11 Baiting Brook Rd Unit 11
- 1239 Edgell Rd
- 18 Harrington Rd
- 5 Baiting Brook Rd Unit 5
Ask me questions while you tour the home.