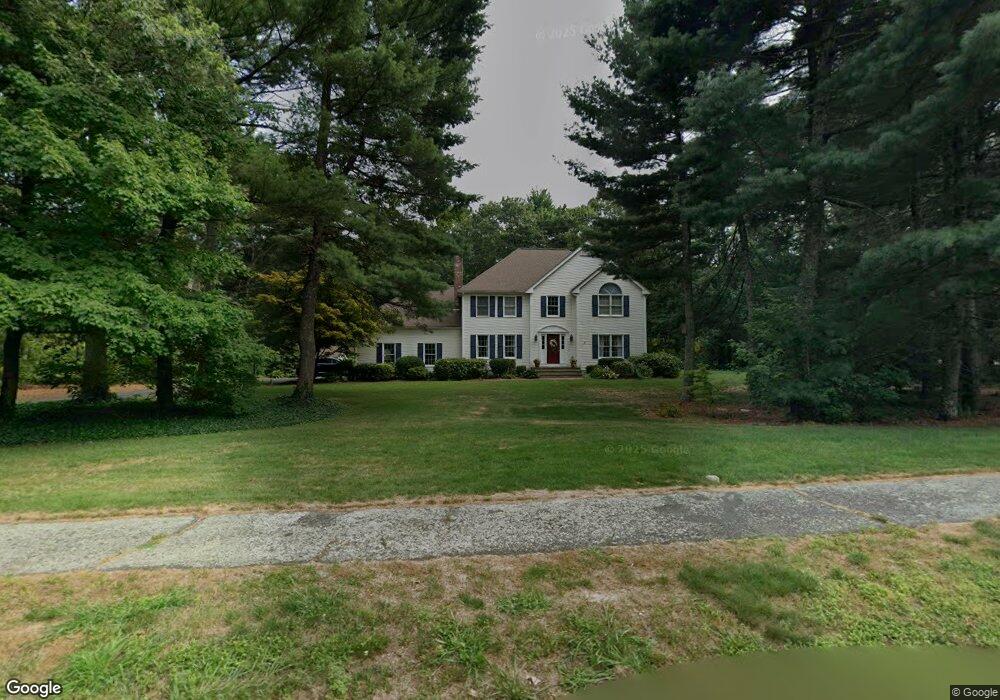
3 Gary Rd Foxboro, MA 02035
Estimated Value: $938,289 - $1,324,000
4
Beds
4
Baths
2,994
Sq Ft
$358/Sq Ft
Est. Value
About This Home
This home is located at 3 Gary Rd, Foxboro, MA 02035 and is currently estimated at $1,071,572, approximately $357 per square foot. 3 Gary Rd is a home located in Norfolk County with nearby schools including Foxborough High School, Foxborough Regional Charter School, and Hands-On-Montessori School.
Ownership History
Date
Name
Owned For
Owner Type
Purchase Details
Closed on
May 21, 1993
Sold by
Mordini Bros Constr
Bought by
Stone Lori A
Current Estimated Value
Home Financials for this Owner
Home Financials are based on the most recent Mortgage that was taken out on this home.
Original Mortgage
$150,000
Interest Rate
7.54%
Mortgage Type
Purchase Money Mortgage
Create a Home Valuation Report for This Property
The Home Valuation Report is an in-depth analysis detailing your home's value as well as a comparison with similar homes in the area
Home Values in the Area
Average Home Value in this Area
Purchase History
| Date | Buyer | Sale Price | Title Company |
|---|---|---|---|
| Stone Lori A | $279,900 | -- |
Source: Public Records
Mortgage History
| Date | Status | Borrower | Loan Amount |
|---|---|---|---|
| Open | Stone Lori A | $60,000 | |
| Closed | Stone Lori A | $150,000 |
Source: Public Records
Tax History
| Year | Tax Paid | Tax Assessment Tax Assessment Total Assessment is a certain percentage of the fair market value that is determined by local assessors to be the total taxable value of land and additions on the property. | Land | Improvement |
|---|---|---|---|---|
| 2025 | $12,133 | $917,800 | $314,800 | $603,000 |
| 2024 | $11,344 | $839,700 | $288,600 | $551,100 |
| 2023 | $10,885 | $766,000 | $275,000 | $491,000 |
| 2022 | $10,495 | $722,800 | $256,700 | $466,100 |
| 2021 | $10,345 | $701,800 | $250,200 | $451,600 |
| 2020 | $10,018 | $687,600 | $250,200 | $437,400 |
| 2019 | $10,099 | $687,000 | $269,200 | $417,800 |
| 2018 | $9,986 | $685,400 | $279,600 | $405,800 |
| 2017 | $9,796 | $651,300 | $270,900 | $380,400 |
| 2016 | $9,701 | $654,600 | $266,200 | $388,400 |
| 2015 | $9,416 | $619,900 | $212,900 | $407,000 |
| 2014 | $9,181 | $612,500 | $212,900 | $399,600 |
Source: Public Records
Map
Nearby Homes
Your Personal Tour Guide
Ask me questions while you tour the home.