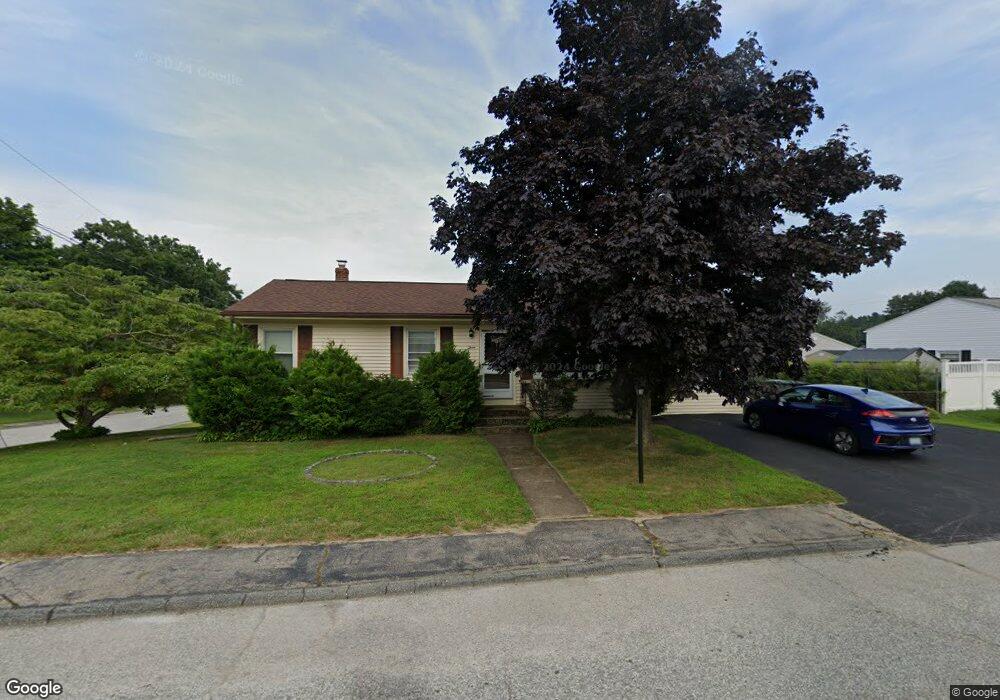
3 Joyce St Coventry, RI 02816
Estimated Value: $394,642 - $441,000
3
Beds
1
Bath
988
Sq Ft
$413/Sq Ft
Est. Value
About This Home
This home is located at 3 Joyce St, Coventry, RI 02816 and is currently estimated at $407,661, approximately $412 per square foot. 3 Joyce St is a home located in Kent County with nearby schools including Alan Shawn Feinstein Ms Of Cov, Coventry High School, and Father John V. Doyle School.
Ownership History
Date
Name
Owned For
Owner Type
Purchase Details
Closed on
Mar 22, 1999
Sold by
Reynolds Raymond C
Bought by
Callaghan Richard T and Callaghan Joan P
Current Estimated Value
Purchase Details
Closed on
Oct 11, 1995
Sold by
Coutu Tr Aaron J
Bought by
Reynolds Raymond C
Create a Home Valuation Report for This Property
The Home Valuation Report is an in-depth analysis detailing your home's value as well as a comparison with similar homes in the area
Purchase History
| Date | Buyer | Sale Price | Title Company |
|---|---|---|---|
| Callaghan Richard T | $103,000 | -- | |
| Reynolds Raymond C | $100,000 | -- |
Source: Public Records
Mortgage History
| Date | Status | Borrower | Loan Amount |
|---|---|---|---|
| Open | Reynolds Raymond C | $110,000 | |
| Closed | Reynolds Raymond C | $25,000 | |
| Closed | Reynolds Raymond C | $99,000 | |
| Closed | Reynolds Raymond C | $82,500 |
Source: Public Records
Tax History
| Year | Tax Paid | Tax Assessment Tax Assessment Total Assessment is a certain percentage of the fair market value that is determined by local assessors to be the total taxable value of land and additions on the property. | Land | Improvement |
|---|---|---|---|---|
| 2025 | $4,784 | $297,300 | $98,600 | $198,700 |
| 2024 | $4,709 | $297,300 | $98,600 | $198,700 |
| 2023 | $4,558 | $297,300 | $98,600 | $198,700 |
| 2022 | $4,546 | $232,300 | $93,300 | $139,000 |
| 2021 | $4,489 | $231,400 | $93,300 | $138,100 |
| 2020 | $5,146 | $231,400 | $93,300 | $138,100 |
| 2019 | $4,054 | $182,300 | $75,400 | $106,900 |
| 2018 | $3,940 | $182,300 | $75,400 | $106,900 |
| 2017 | $3,825 | $182,300 | $75,400 | $106,900 |
| 2016 | $3,655 | $170,700 | $82,600 | $88,100 |
| 2015 | $3,556 | $170,700 | $82,600 | $88,100 |
| 2014 | $3,481 | $170,700 | $82,600 | $88,100 |
| 2013 | $3,411 | $182,800 | $81,400 | $101,400 |
Source: Public Records
Map
Nearby Homes
Your Personal Tour Guide
Ask me questions while you tour the home.