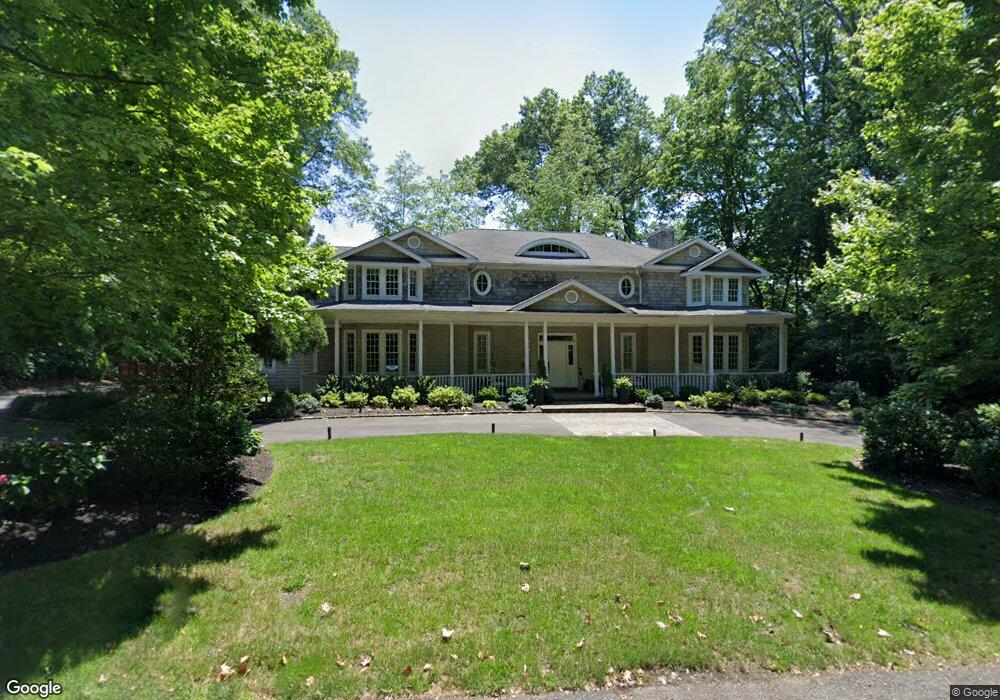
3 Luquer Rd Manhasset, NY 11030
Estimated Value: $3,867,025
5
Beds
6
Baths
5,000
Sq Ft
$773/Sq Ft
Est. Value
About This Home
This home is located at 3 Luquer Rd, Manhasset, NY 11030 and is currently estimated at $3,867,025, approximately $773 per square foot. 3 Luquer Rd is a home located in Nassau County with nearby schools including Manhasset Secondary School, Happy Montessori School, and St Mary's Elementary School.
Ownership History
Date
Name
Owned For
Owner Type
Purchase Details
Closed on
Nov 14, 2023
Sold by
Vore Adam M and Vore Barbara C
Bought by
Amend Gregory and Amend Susanna
Current Estimated Value
Home Financials for this Owner
Home Financials are based on the most recent Mortgage that was taken out on this home.
Original Mortgage
$2,715,600
Outstanding Balance
$2,667,136
Interest Rate
7.63%
Mortgage Type
New Conventional
Estimated Equity
$1,493,598
Purchase Details
Closed on
Jun 15, 2015
Sold by
Foreman Alba N and Foreman Mark
Bought by
Vore Adam M and Vore Barbara C
Purchase Details
Closed on
Mar 15, 2005
Sold by
Peters Paul
Bought by
Foreman Alba
Purchase Details
Closed on
Oct 21, 2004
Sold by
10 North Court Developmen
Bought by
Peters Paul
Purchase Details
Closed on
Sep 26, 2003
Sold by
Margaret K Mcdonough
Purchase Details
Closed on
Jun 7, 1995
Sold by
Mcdonough Margaret
Bought by
Margaret K Mcdonough Trust
Create a Home Valuation Report for This Property
The Home Valuation Report is an in-depth analysis detailing your home's value as well as a comparison with similar homes in the area
Home Values in the Area
Average Home Value in this Area
Purchase History
| Date | Buyer | Sale Price | Title Company |
|---|---|---|---|
| Amend Gregory | $3,400,000 | First American Title Ins Co | |
| Amend Gregory | $3,400,000 | First American Title Ins Co | |
| Amend Gregory | $3,400,000 | First American Title Ins Co | |
| Amend Gregory | $3,400,000 | First American Title Ins Co | |
| Vore Adam M | $2,800,000 | Judicial Title | |
| Vore Adam M | $2,800,000 | Judicial Title | |
| Vore Adam M | $2,800,000 | Judicial Title | |
| Foreman Alba | $2,485,000 | -- | |
| Foreman Alba | $2,485,000 | -- | |
| Peters Paul | $2,375,000 | -- | |
| Peters Paul | $2,375,000 | -- | |
| -- | $875,000 | -- | |
| -- | $875,000 | -- | |
| Margaret K Mcdonough Trust | -- | -- | |
| Margaret K Mcdonough Trust | -- | -- |
Source: Public Records
Mortgage History
| Date | Status | Borrower | Loan Amount |
|---|---|---|---|
| Open | Amend Gregory | $2,715,600 | |
| Closed | Amend Gregory | $2,715,600 |
Source: Public Records
Tax History
| Year | Tax Paid | Tax Assessment Tax Assessment Total Assessment is a certain percentage of the fair market value that is determined by local assessors to be the total taxable value of land and additions on the property. | Land | Improvement |
|---|---|---|---|---|
| 2025 | $60,314 | $3,965 | $1,245 | $2,720 |
| 2024 | $17,026 | $3,965 | $1,245 | $2,720 |
Source: Public Records
Map
Nearby Homes
- 11 Muriel Rd
- 27 Oakland Dr
- 35 Mitchell Rd
- 8 Chelsea Dr
- 107 Bayview Rd
- 23 Ivy Way
- 2 Stonytown Rd
- 68 Carlton Ave
- 454 Main St
- 7 Anchorage Rd
- 433 Main St Unit 212
- 433 Main St Unit 103
- 6 Janssen Dr
- 44 North Dr
- 59 Colonial Dr
- 37 Carlton Ave
- 44 Mackey Ave
- 22 Madison St Unit L
- 99 Madison St Unit 6U
- 1054 Plandome Rd
Your Personal Tour Guide
Ask me questions while you tour the home.