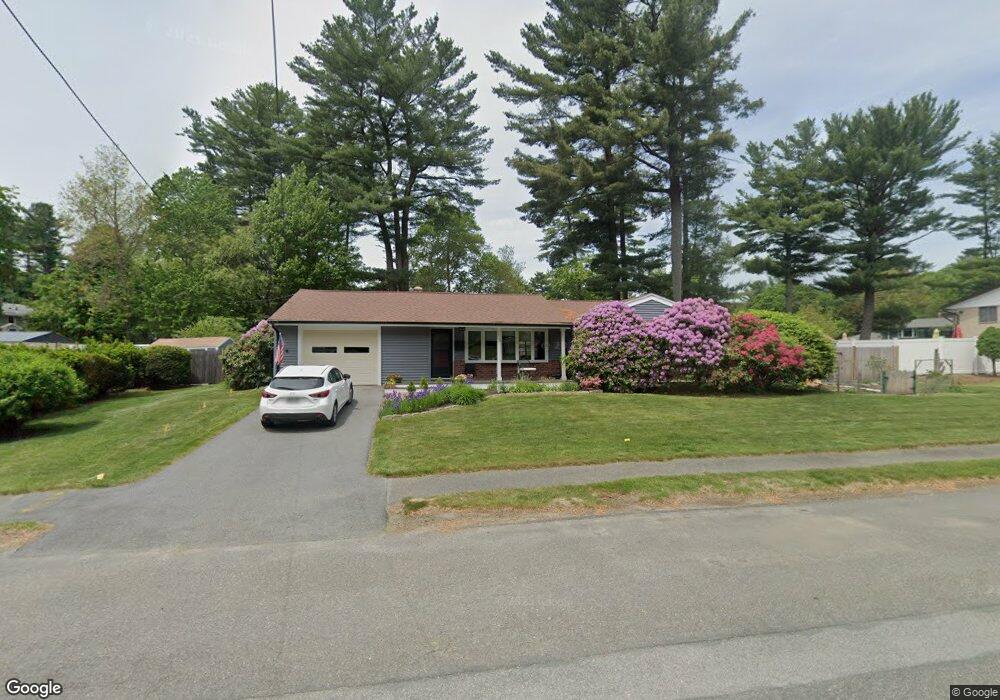
3 Rutledge Rd Peabody, MA 01960
West Peabody NeighborhoodEstimated Value: $661,366 - $728,000
3
Beds
2
Baths
1,417
Sq Ft
$491/Sq Ft
Est. Value
About This Home
This home is located at 3 Rutledge Rd, Peabody, MA 01960 and is currently estimated at $695,092, approximately $490 per square foot. 3 Rutledge Rd is a home located in Essex County with nearby schools including Peabody Veterans Memorial High School and Covenant Christian Academy.
Ownership History
Date
Name
Owned For
Owner Type
Purchase Details
Closed on
Dec 8, 2023
Sold by
Bacigalupo Nancy
Bought by
Nancy A Bacigalupo Lt and Bacigalupo
Current Estimated Value
Purchase Details
Closed on
Aug 29, 2008
Sold by
Bacigalupo Nancy and Milne Theresa
Bought by
Bacigalupo Nancy
Purchase Details
Closed on
Oct 1, 2004
Sold by
Hyler Earl S and Hyler Janet A
Bought by
Milne Theresa and Bacigalupo Nancy
Create a Home Valuation Report for This Property
The Home Valuation Report is an in-depth analysis detailing your home's value as well as a comparison with similar homes in the area
Home Values in the Area
Average Home Value in this Area
Purchase History
We collect this data history from publicly available records. To have your information removed, we recommend requesting removal directly through your county’s website.
| Date | Buyer | Sale Price | Title Company |
|---|---|---|---|
| Nancy A Bacigalupo Lt | -- | None Available | |
| Bacigalupo Nancy | $8,000 | -- | |
| Milne Theresa | $375,000 | -- |
Source: Public Records
Mortgage History
We collect this data history from publicly available records. To have your information removed, we recommend requesting removal directly through your county’s website.
| Date | Status | Borrower | Loan Amount |
|---|---|---|---|
| Previous Owner | Milne Theresa | $301,000 |
Source: Public Records
Tax History
| Year | Tax Paid | Tax Assessment Tax Assessment Total Assessment is a certain percentage of the fair market value that is determined by local assessors to be the total taxable value of land and additions on the property. | Land | Improvement |
|---|---|---|---|---|
| 2025 | $5,299 | $572,200 | $319,100 | $253,100 |
| 2024 | $5,059 | $554,700 | $319,100 | $235,600 |
| 2023 | $4,822 | $506,500 | $265,900 | $240,600 |
| 2022 | $4,708 | $466,100 | $231,200 | $234,900 |
| 2021 | $4,303 | $410,200 | $210,200 | $200,000 |
| 2020 | $4,225 | $393,400 | $210,200 | $183,200 |
| 2019 | $4,231 | $384,300 | $210,200 | $174,100 |
| 2018 | $4,028 | $351,500 | $187,700 | $163,800 |
| 2017 | $3,748 | $318,700 | $187,700 | $131,000 |
| 2016 | $3,960 | $332,200 | $187,700 | $144,500 |
| 2015 | $3,699 | $300,700 | $187,700 | $113,000 |
Source: Public Records
Map
Nearby Homes
Your Personal Tour Guide
Ask me questions while you tour the home.