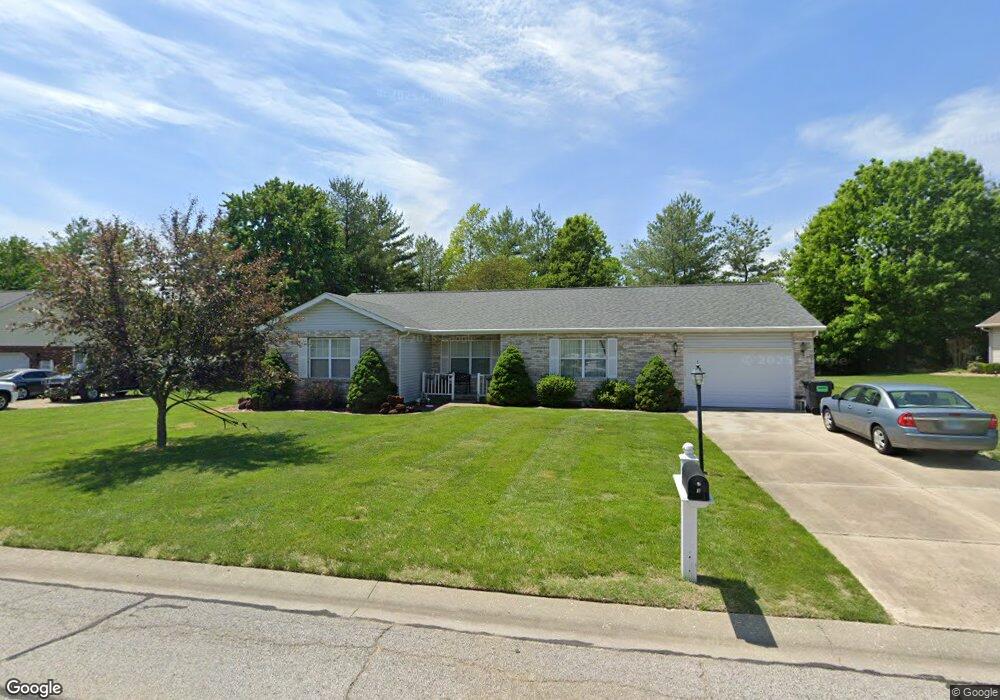
3 Shellie Ct Fairview Heights, IL 62208
Fairview Heights AreaEstimated Value: $223,000 - $327,000
About This Home
This home is located at 3 Shellie Ct, Fairview Heights, IL 62208 and is currently estimated at $264,636, approximately $140 per square foot. 3 Shellie Ct is a home located in St. Clair County with nearby schools including Illini Elementary School, Grant Middle School, and Sister Thea Bowman Catholic School.
Ownership History
We collect this data history from publicly available records. To have your information removed, we recommend requesting removal directly through your county’s website.
Purchase Details
Home Financials for this Owner
Home Financials are based on the most recent Mortgage that was taken out on this home.Purchase Details
Home Values in the Area
Average Home Value in this Area
Purchase History
We collect this data history from publicly available records. To have your information removed, we recommend requesting removal directly through your county’s website.
| Date | Buyer | Sale Price | Title Company |
|---|---|---|---|
| $120,000 | Town & Country Title Co | ||
| -- | None Available |
Mortgage History
We collect this data history from publicly available records. To have your information removed, we recommend requesting removal directly through your county’s website.
| Date | Status | Borrower | Loan Amount |
|---|---|---|---|
| Open | $53,000 | ||
| Open | $90,000 |
Tax History
We collect this data history from publicly available records. To have your information removed, we recommend requesting removal directly through your county’s website.
| Year | Tax Paid | Tax Assessment Tax Assessment Total Assessment is a certain percentage of the fair market value that is determined by local assessors to be the total taxable value of land and additions on the property. | Land | Improvement |
|---|---|---|---|---|
| 2024 | $3,414 | $54,259 | $3,383 | $50,876 |
| 2023 | $3,138 | $48,008 | $2,993 | $45,015 |
| 2022 | $3,041 | $46,112 | $2,933 | $43,179 |
| 2021 | $2,855 | $43,766 | $2,784 | $40,982 |
| 2020 | $2,790 | $41,459 | $2,638 | $38,821 |
| 2019 | $2,663 | $41,459 | $2,638 | $38,821 |
| 2018 | $2,756 | $42,531 | $2,820 | $39,711 |
| 2017 | $2,664 | $40,806 | $2,706 | $38,100 |
| 2016 | $2,675 | $39,885 | $2,645 | $37,240 |
| 2014 | $3,269 | $51,372 | $8,282 | $43,090 |
| 2013 | $3,604 | $52,319 | $8,435 | $43,884 |
Map
- 14 Circle Dr
- 9449 Marbarry Dr
- 300 Bunkum Woods Dr
- 200 Bunkum Woods Dr
- 204 Bunkum Woods Dr
- 212 Bunkum Woods Dr
- 334 Pleasant Ridge Rd
- 120 Bunkum Woods Dr
- 116 Bunkum Woods Dr
- 9114 Birchwood Ct
- 9110 Birchwood Ct
- 115 Bunkum Woods Dr
- 205 Bunkum Woods Dr
- 9162 Basswood Dr
- 209 Bunkum Woods Dr
- 9158 Basswood Dr
- 9109 Birchwood Ct
- 9150 Basswood Dr
- 9146 Basswood Dr
- 9101 Birchwood Ct
Ask me questions while you tour the home.