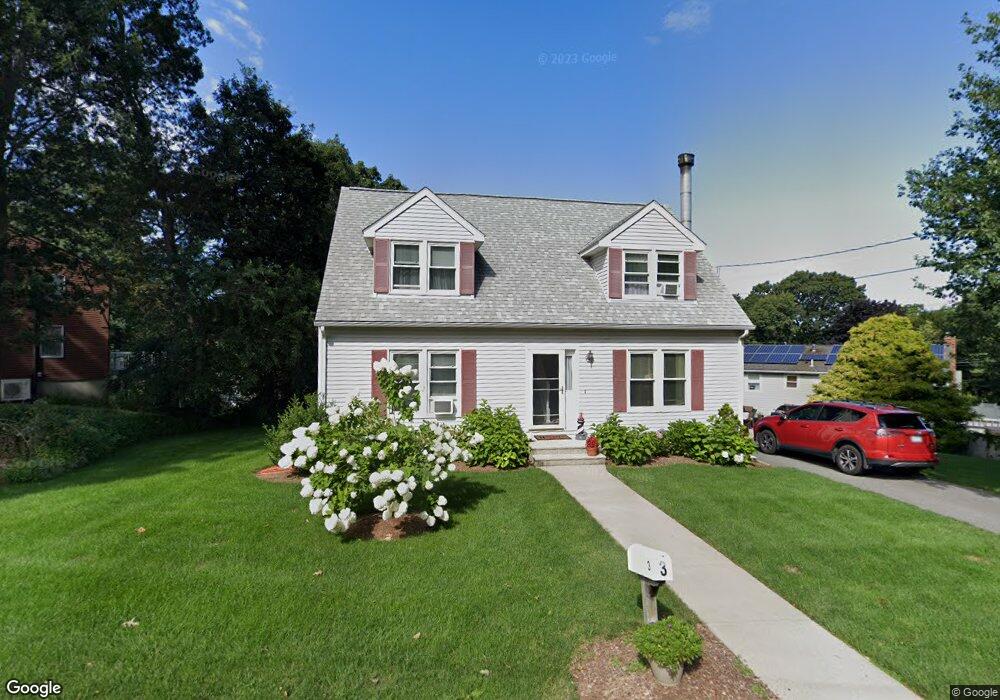
3 Skyview Rd Woburn, MA 01801
Downtown Woburn NeighborhoodEstimated Value: $793,000 - $864,000
4
Beds
2
Baths
1,555
Sq Ft
$532/Sq Ft
Est. Value
About This Home
This home is located at 3 Skyview Rd, Woburn, MA 01801 and is currently estimated at $827,050, approximately $531 per square foot. 3 Skyview Rd is a home located in Middlesex County with nearby schools including Shamrock Elementary School, Daniel L. Joyce Middle School, and Woburn High School.
Ownership History
Date
Name
Owned For
Owner Type
Purchase Details
Closed on
Nov 3, 1999
Sold by
Young Chester S
Bought by
Quinn Marc E and Quinn Sandra M
Current Estimated Value
Home Financials for this Owner
Home Financials are based on the most recent Mortgage that was taken out on this home.
Original Mortgage
$180,800
Outstanding Balance
$55,112
Interest Rate
7.73%
Mortgage Type
Purchase Money Mortgage
Estimated Equity
$771,938
Create a Home Valuation Report for This Property
The Home Valuation Report is an in-depth analysis detailing your home's value as well as a comparison with similar homes in the area
Home Values in the Area
Average Home Value in this Area
Purchase History
We collect this data history from publicly available records. To have your information removed, we recommend requesting removal directly through your county’s website.
| Date | Buyer | Sale Price | Title Company |
|---|---|---|---|
| Quinn Marc E | $244,000 | -- |
Source: Public Records
Mortgage History
We collect this data history from publicly available records. To have your information removed, we recommend requesting removal directly through your county’s website.
| Date | Status | Borrower | Loan Amount |
|---|---|---|---|
| Open | Quinn Marc E | $180,800 | |
| Previous Owner | Quinn Marc E | $148,000 |
Source: Public Records
Tax History
| Year | Tax Paid | Tax Assessment Tax Assessment Total Assessment is a certain percentage of the fair market value that is determined by local assessors to be the total taxable value of land and additions on the property. | Land | Improvement |
|---|---|---|---|---|
| 2025 | $6,472 | $757,800 | $368,300 | $389,500 |
| 2024 | $5,851 | $725,900 | $350,800 | $375,100 |
| 2023 | $5,743 | $660,100 | $318,900 | $341,200 |
| 2022 | $5,587 | $598,200 | $277,400 | $320,800 |
| 2021 | $11,714 | $564,700 | $264,200 | $300,500 |
| 2020 | $5,010 | $537,500 | $264,200 | $273,300 |
| 2019 | $9,154 | $519,200 | $251,600 | $267,600 |
| 2018 | $4,711 | $476,300 | $230,900 | $245,400 |
| 2017 | $8,222 | $443,000 | $219,900 | $223,100 |
| 2016 | $4,205 | $418,400 | $205,600 | $212,800 |
| 2015 | $4,049 | $398,100 | $192,100 | $206,000 |
| 2014 | $3,780 | $362,100 | $192,100 | $170,000 |
Source: Public Records
Map
Nearby Homes
- 39 Blueberry Hill Rd
- 0 Mount Pleasant St
- 12 Highland Ave
- 8 Harvard Street Extension
- 201 Main St Unit 31
- 164 Green St
- 380 Cross St
- 3 Conn St Unit 3
- 219 Montvale Ae
- 55 Brookside Ave
- 5 Ingalls St
- 35 Montvale Ave Unit 3
- 18 Sherman Place
- 31 Montvale Ave Unit 2
- 7 Prospect St
- 6 Richmond Park
- 44 Warren Ave Unit B
- 41 Cross St
- 28 Everett St
- 6 Packard St
- 5 Skyview Rd
- 23 Blueberry Hill Rd
- 21 Blueberry Hill Rd
- 6 Skyview Rd
- 4 Skyview Rd
- 8 Skyview Rd
- 19 Blueberry Hill Rd
- 19 Blueberry Hill Rd Unit SF
- 7 Skyview Rd
- 5-7 Allen St Unit 5
- 25 Blueberry Hill Rd
- 24 Blueberry Hill Rd
- 26 Fulton St
- 8 Skyview Ln
- 10 Skyview Rd
- 26 Blueberry Hill Rd
- 6 Skyview Ln
- 20 Blueberry Hill Rd
- 4 Skyview Ln
- 10 Skyview Ln
Your Personal Tour Guide
Ask me questions while you tour the home.