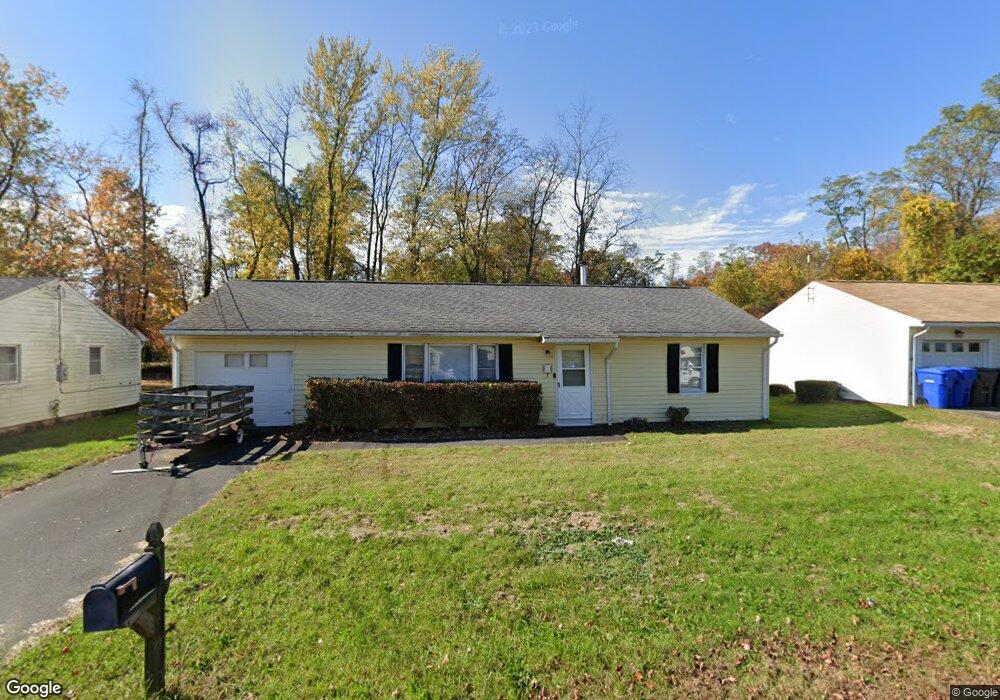
3 South Rd East Windsor, CT 06088
Estimated Value: $228,644
2
Beds
1
Bath
1,025
Sq Ft
$223/Sq Ft
Est. Value
About This Home
This home is located at 3 South Rd, East Windsor, CT 06088 and is currently priced at $228,644, approximately $223 per square foot. 3 South Rd is a home located in Hartford County with nearby schools including Broad Brook Elementary School, East Windsor Middle School, and East Windsor High School.
Ownership History
Date
Name
Owned For
Owner Type
Purchase Details
Closed on
Mar 16, 2023
Sold by
East Windsor Town Of
Bought by
Malenfant Joseph P and Malenfant Luce J
Current Estimated Value
Purchase Details
Closed on
Apr 30, 2020
Sold by
Malenfant Joseph
Bought by
Malenfant Luce
Purchase Details
Closed on
Dec 4, 2002
Sold by
Bushey Frederick
Bought by
Cegalis William
Purchase Details
Closed on
Nov 30, 2001
Sold by
Colton Lisa and Colton Walter
Bought by
Bushey Frederick F and Bushey Fredrick W
Home Financials for this Owner
Home Financials are based on the most recent Mortgage that was taken out on this home.
Original Mortgage
$83,650
Interest Rate
6.66%
Purchase Details
Closed on
Apr 30, 1999
Sold by
Russo Patricia
Bought by
Bourque Matthew and Bourque Sarah
Home Financials for this Owner
Home Financials are based on the most recent Mortgage that was taken out on this home.
Original Mortgage
$128,418
Interest Rate
6.95%
Purchase Details
Closed on
Nov 29, 1993
Sold by
Creative Housing Inc
Bought by
Goss Lisa and Colton Walter
Create a Home Valuation Report for This Property
The Home Valuation Report is an in-depth analysis detailing your home's value as well as a comparison with similar homes in the area
Home Values in the Area
Average Home Value in this Area
Purchase History
| Date | Buyer | Sale Price | Title Company |
|---|---|---|---|
| Malenfant Joseph P | -- | None Available | |
| Malenfant Luce | -- | None Available | |
| Cegalis William | $104,000 | -- | |
| Bushey Frederick F | $85,000 | -- | |
| Bourque Matthew | $125,900 | -- | |
| Goss Lisa | $58,500 | -- |
Source: Public Records
Mortgage History
| Date | Status | Borrower | Loan Amount |
|---|---|---|---|
| Previous Owner | Goss Lisa | $83,650 | |
| Previous Owner | Goss Lisa | $21,443 | |
| Previous Owner | Goss Lisa | $128,418 | |
| Previous Owner | Goss Lisa | $27,230 |
Source: Public Records
Tax History
| Year | Tax Paid | Tax Assessment Tax Assessment Total Assessment is a certain percentage of the fair market value that is determined by local assessors to be the total taxable value of land and additions on the property. | Land | Improvement |
|---|---|---|---|---|
| 2023 | $1,090 | $31,800 | $0 | $31,800 |
| 2022 | $1,155 | $31,800 | $0 | $31,800 |
| 2021 | $1,158 | $31,800 | $0 | $31,800 |
| 2020 | $1,158 | $31,800 | $0 | $31,800 |
| 2019 | $1,134 | $31,800 | $0 | $31,800 |
| 2018 | $1,123 | $31,800 | $0 | $31,800 |
| 2017 | $1,002 | $29,400 | $0 | $29,400 |
| 2016 | $945 | $29,400 | $0 | $29,400 |
| 2015 | $891 | $29,400 | $0 | $29,400 |
| 2014 | $876 | $29,400 | $0 | $29,400 |
Source: Public Records
Map
Nearby Homes
- 122 S Main St
- 5 David Dr Unit 5
- 0 Abbe Rd
- 1 Riverview Dr Unit B
- 27 Pasco Dr Unit B
- 102 Scantic Rd
- 957 Palisado Ave
- 241 S Water St Unit 14
- 248 Adams Hill Way Unit 248
- 217 Adams Hill Way
- 24 MacKtown Rd
- 169 Greenwoods Ln Unit 169
- 216 Wells Rd
- 1 Rose Ct
- 25 Pine St
- 0 Ellsworth Rd
- 17 Cathy (Lot 18) Ln
- 19 Cathy (Lot 19) Ln
- 18 Cathy (Lot 17) Ln
- 27 W River Rd
Your Personal Tour Guide
Ask me questions while you tour the home.