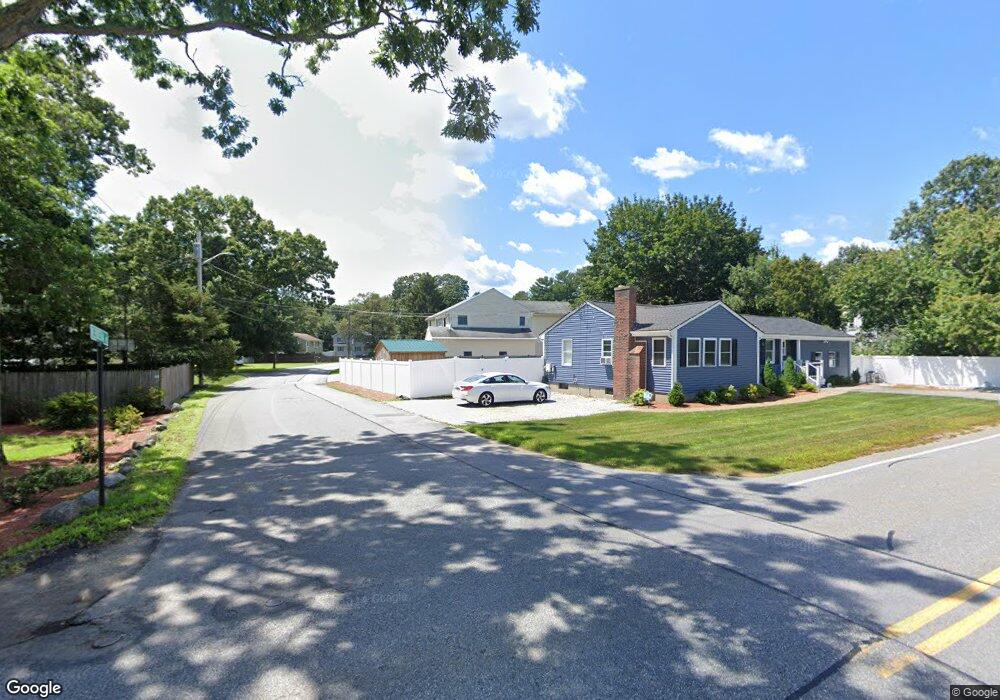
3 Verbena Rd Billerica, MA 01821
Estimated Value: $653,000 - $837,000
4
Beds
3
Baths
3,483
Sq Ft
$225/Sq Ft
Est. Value
About This Home
This home is located at 3 Verbena Rd, Billerica, MA 01821 and is currently estimated at $783,371, approximately $224 per square foot. 3 Verbena Rd is a home located in Middlesex County with nearby schools including Billerica Memorial High School.
Ownership History
Date
Name
Owned For
Owner Type
Purchase Details
Closed on
Jul 22, 2022
Sold by
Kwan Tommy W and Kwan Ada W
Bought by
Ta Kwan Irt and Kwan
Current Estimated Value
Purchase Details
Closed on
Apr 30, 1987
Sold by
Walker George P
Bought by
Kwan Tommy W
Home Financials for this Owner
Home Financials are based on the most recent Mortgage that was taken out on this home.
Original Mortgage
$100,000
Interest Rate
8.99%
Mortgage Type
Purchase Money Mortgage
Create a Home Valuation Report for This Property
The Home Valuation Report is an in-depth analysis detailing your home's value as well as a comparison with similar homes in the area
Purchase History
| Date | Buyer | Sale Price | Title Company |
|---|---|---|---|
| Ta Kwan Irt | -- | None Available | |
| Kwan Tommy W | $140,000 | -- |
Source: Public Records
Mortgage History
| Date | Status | Borrower | Loan Amount |
|---|---|---|---|
| Previous Owner | Kwan Tommy W | $150,000 | |
| Previous Owner | Kwan Tommy W | $78,000 | |
| Previous Owner | Kwan Tommy W | $100,000 |
Source: Public Records
Tax History
| Year | Tax Paid | Tax Assessment Tax Assessment Total Assessment is a certain percentage of the fair market value that is determined by local assessors to be the total taxable value of land and additions on the property. | Land | Improvement |
|---|---|---|---|---|
| 2025 | $7,697 | $677,000 | $277,200 | $399,800 |
| 2024 | $7,475 | $662,100 | $271,700 | $390,400 |
| 2023 | $7,143 | $601,800 | $237,100 | $364,700 |
| 2022 | $6,390 | $505,500 | $206,100 | $299,400 |
| 2021 | $6,169 | $474,500 | $182,000 | $292,500 |
| 2020 | $6,066 | $467,000 | $174,500 | $292,500 |
| 2019 | $6,203 | $460,200 | $174,500 | $285,700 |
| 2018 | $5,977 | $421,200 | $154,900 | $266,300 |
| 2017 | $5,642 | $400,400 | $150,000 | $250,400 |
| 2016 | $5,616 | $397,200 | $146,800 | $250,400 |
| 2015 | $5,577 | $397,200 | $146,800 | $250,400 |
| 2014 | $5,642 | $394,800 | $140,600 | $254,200 |
Source: Public Records
Map
Nearby Homes
- 31 George Brown St
- 29 Donald Rd
- 13 Brookside Dr
- 460 Shawsheen Ave
- 13 Radcliffe Rd Unit A
- 13 Radcliffe Rd Unit B
- 2 Rhode Island Rd
- 11 Edgeworth St
- 3 Memory Ln
- 436 Foster Rd
- 6 3rd St
- 18 Knollwood Rd
- 111 Grove Ave
- 33 Pratt St
- 29 Maplewood Ave
- 56 Lake St
- 7 Avon St
- 36 Allen Rd
- 46 Cottage St
- 26 Ironwood Ln
Your Personal Tour Guide
Ask me questions while you tour the home.