3 Walnut Rd Wenham, MA 01984
Estimated Value: $975,000 - $1,301,000
4
Beds
4
Baths
3,020
Sq Ft
$374/Sq Ft
Est. Value
About This Home
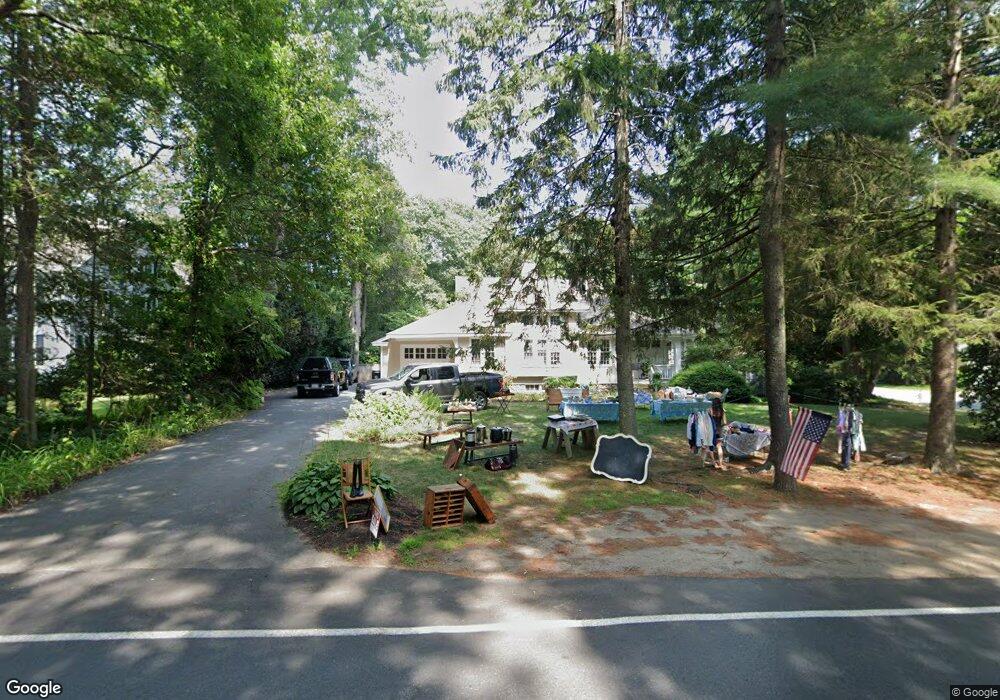
This home is located at 3 Walnut Rd, Wenham, MA 01984 and is currently estimated at $1,128,605, approximately $373 per square foot. 3 Walnut Rd is a home located in Essex County with nearby schools including Winthrop School, Cutler Elementary School, and Bessie Buker Elementary School.
Ownership History
Date
Name
Owned For
Owner Type
Purchase Details
Closed on
Jan 23, 2017
Sold by
Meredith Heard Gisness and Meredith Gisness
Bought by
Haydock Charles T and Haydock Alexandra S
Current Estimated Value
Purchase Details
Closed on
Dec 31, 2014
Sold by
Donovan Jay C and Donovan Robun A
Bought by
3 Walnut Road Llc
Purchase Details
Closed on
Sep 30, 1994
Sold by
Mcdonough Lisa
Bought by
Harvey James B and Harvey Laurie
Purchase Details
Closed on
May 26, 1988
Sold by
Crawford Vernon L
Bought by
Mcdonough Mark M
Create a Home Valuation Report for This Property
The Home Valuation Report is an in-depth analysis detailing your home's value as well as a comparison with similar homes in the area
Home Values in the Area
Average Home Value in this Area
Purchase History
| Date | Buyer | Sale Price | Title Company |
|---|---|---|---|
| Haydock Charles T | $845,000 | -- | |
| Haydock Charles T | $845,000 | -- | |
| Haydock Charles T | $845,000 | -- | |
| 3 Walnut Road Llc | -- | -- | |
| 3 Walnut Road Llc | -- | -- | |
| Harvey James B | $400,000 | -- | |
| Harvey James B | $400,000 | -- | |
| Mcdonough Mark M | $302,000 | -- |
Source: Public Records
Mortgage History
| Date | Status | Borrower | Loan Amount |
|---|---|---|---|
| Previous Owner | Mcdonough Mark M | $259,300 | |
| Previous Owner | Mcdonough Mark M | $130,000 |
Source: Public Records
Tax History
| Year | Tax Paid | Tax Assessment Tax Assessment Total Assessment is a certain percentage of the fair market value that is determined by local assessors to be the total taxable value of land and additions on the property. | Land | Improvement |
|---|---|---|---|---|
| 2025 | $13,655 | $878,700 | $375,000 | $503,700 |
| 2024 | $15,245 | $973,500 | $500,300 | $473,200 |
| 2023 | $13,823 | $796,700 | $500,800 | $295,900 |
| 2022 | $13,256 | $677,000 | $386,600 | $290,400 |
| 2021 | $12,759 | $648,300 | $357,900 | $290,400 |
| 2020 | $11,898 | $628,200 | $353,800 | $274,400 |
| 2019 | $11,320 | $628,200 | $353,800 | $274,400 |
| 2018 | $10,088 | $536,900 | $342,400 | $194,500 |
| 2017 | $9,841 | $536,900 | $342,400 | $194,500 |
| 2016 | $9,117 | $536,900 | $342,400 | $194,500 |
| 2015 | $8,725 | $536,900 | $342,400 | $194,500 |
Source: Public Records
Map
Nearby Homes
Your Personal Tour Guide
Ask me questions while you tour the home.