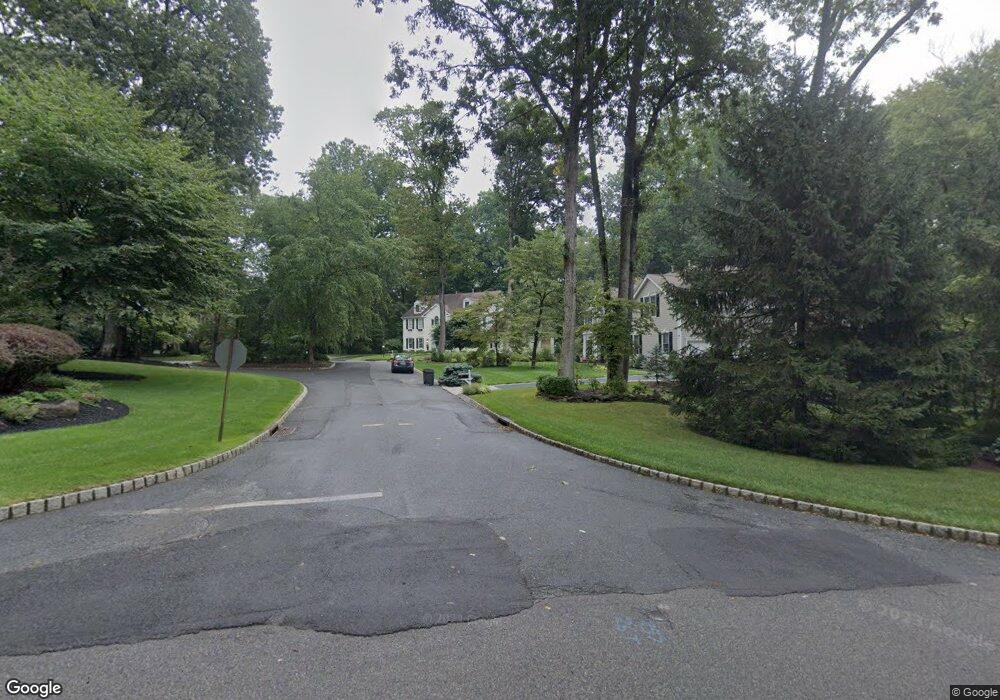
3 Wycoff Way Unit B1 Mendham, NJ 07945
Estimated Value: $1,685,000 - $1,947,000
Studio
--
Bath
4,800
Sq Ft
$370/Sq Ft
Est. Value
About This Home
This home is located at 3 Wycoff Way Unit B1, Mendham, NJ 07945 and is currently estimated at $1,775,447, approximately $369 per square foot. 3 Wycoff Way Unit B1 is a home located in Morris County with nearby schools including Mendham Township Elementary School, Mendham Township Middle School, and West Morris Mendham High School.
Ownership History
Date
Name
Owned For
Owner Type
Purchase Details
Closed on
Mar 26, 2025
Sold by
Carney Patrick and Carney Marcella
Bought by
Carney Living Trust and Carney
Current Estimated Value
Purchase Details
Closed on
May 24, 1999
Sold by
Jackson Homes At Brookrace Lp
Bought by
Carney Patrick and Carney Marcella
Home Financials for this Owner
Home Financials are based on the most recent Mortgage that was taken out on this home.
Original Mortgage
$601,295
Interest Rate
6.85%
Create a Home Valuation Report for This Property
The Home Valuation Report is an in-depth analysis detailing your home's value as well as a comparison with similar homes in the area
Home Values in the Area
Average Home Value in this Area
Purchase History
We collect this data history from publicly available records. To have your information removed, we recommend requesting removal directly through your county’s website.
| Date | Buyer | Sale Price | Title Company |
|---|---|---|---|
| Carney Living Trust | -- | None Listed On Document | |
| Carney Living Trust | -- | None Listed On Document | |
| Carney Patrick | $250,000 | -- |
Source: Public Records
Mortgage History
We collect this data history from publicly available records. To have your information removed, we recommend requesting removal directly through your county’s website.
| Date | Status | Borrower | Loan Amount |
|---|---|---|---|
| Previous Owner | Carney Patrick | $601,295 |
Source: Public Records
Tax History
| Year | Tax Paid | Tax Assessment Tax Assessment Total Assessment is a certain percentage of the fair market value that is determined by local assessors to be the total taxable value of land and additions on the property. | Land | Improvement |
|---|---|---|---|---|
| 2025 | $26,153 | $1,506,000 | $630,800 | $875,200 |
| 2024 | $25,436 | $1,346,700 | $510,600 | $836,100 |
| 2023 | $25,436 | $1,217,600 | $452,500 | $765,100 |
| 2022 | $25,846 | $1,175,900 | $438,000 | $737,900 |
| 2021 | $25,846 | $1,167,900 | $490,400 | $677,500 |
| 2020 | $25,682 | $1,167,900 | $490,400 | $677,500 |
| 2019 | $25,203 | $1,167,900 | $490,400 | $677,500 |
| 2018 | $24,724 | $1,167,900 | $490,400 | $677,500 |
| 2017 | $24,152 | $1,167,900 | $490,400 | $677,500 |
| 2016 | $24,117 | $1,167,900 | $490,400 | $677,500 |
| 2015 | $23,673 | $1,167,900 | $490,400 | $677,500 |
| 2014 | $23,136 | $1,167,900 | $490,400 | $677,500 |
Source: Public Records
Map
Nearby Homes
Your Personal Tour Guide
Ask me questions while you tour the home.