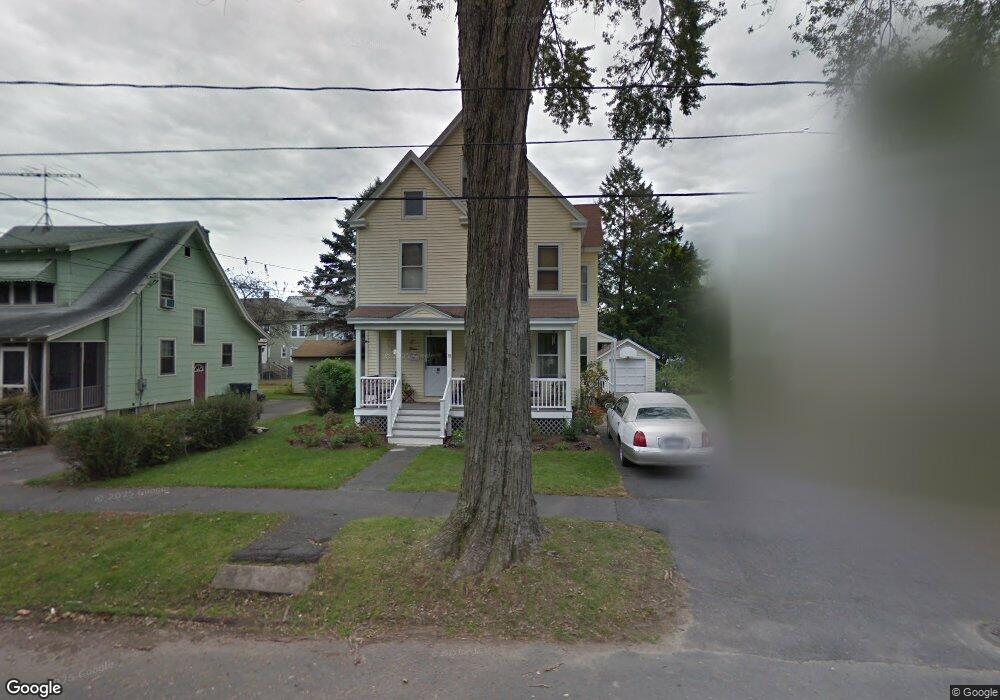
30 Allen Ave Westfield, MA 01085
Estimated Value: $311,000 - $323,000
3
Beds
2
Baths
1,664
Sq Ft
$191/Sq Ft
Est. Value
About This Home
This home is located at 30 Allen Ave, Westfield, MA 01085 and is currently estimated at $317,007, approximately $190 per square foot. 30 Allen Ave is a home located in Hampden County with nearby schools including Westfield High School and Saint Mary High School.
Ownership History
Date
Name
Owned For
Owner Type
Purchase Details
Closed on
Oct 9, 2024
Sold by
Pierce Lynda S
Bought by
Lynda Sue Pierce Irt and Pierce
Current Estimated Value
Purchase Details
Closed on
Oct 12, 1984
Bought by
Pierce Richard S and Pierce Lynda S
Create a Home Valuation Report for This Property
The Home Valuation Report is an in-depth analysis detailing your home's value as well as a comparison with similar homes in the area
Home Values in the Area
Average Home Value in this Area
Purchase History
| Date | Buyer | Sale Price | Title Company |
|---|---|---|---|
| Lynda Sue Pierce Irt | -- | None Available | |
| Lynda Sue Pierce Irt | -- | None Available | |
| Pierce Richard S | -- | -- |
Source: Public Records
Mortgage History
| Date | Status | Borrower | Loan Amount |
|---|---|---|---|
| Previous Owner | Pierce Richard S | $67,000 | |
| Previous Owner | Pierce Richard S | $25,000 | |
| Previous Owner | Pierce Richard S | $11,500 | |
| Previous Owner | Pierce Richard S | $72,000 |
Source: Public Records
Tax History
| Year | Tax Paid | Tax Assessment Tax Assessment Total Assessment is a certain percentage of the fair market value that is determined by local assessors to be the total taxable value of land and additions on the property. | Land | Improvement |
|---|---|---|---|---|
| 2025 | $4,165 | $274,400 | $96,600 | $177,800 |
| 2024 | $4,013 | $251,300 | $87,800 | $163,500 |
| 2023 | $3,863 | $227,500 | $83,700 | $143,800 |
| 2022 | $3,709 | $200,600 | $74,700 | $125,900 |
| 2021 | $3,570 | $189,100 | $70,400 | $118,700 |
| 2020 | $3,469 | $180,200 | $70,400 | $109,800 |
| 2019 | $3,371 | $171,400 | $67,000 | $104,400 |
| 2018 | $3,318 | $171,400 | $67,000 | $104,400 |
| 2017 | $3,280 | $168,900 | $68,100 | $100,800 |
| 2016 | $3,283 | $168,900 | $68,100 | $100,800 |
| 2015 | $3,131 | $168,900 | $68,100 | $100,800 |
| 2014 | $2,340 | $168,900 | $68,100 | $100,800 |
Source: Public Records
Map
Nearby Homes
- 32 Allen Ave
- 42R Jefferson St
- 19 Kellogg St
- 7 Washington St
- 4 Belmont St
- 3 Belmont St
- 97 Mechanic St
- 16 Squawfield Rd
- 42 Putnam Dr
- Lot 5 Montgomery
- 9 Montgomery St
- 70 S Maple St
- 74 S Maple St
- 100 Meadow St
- 324 Russell Rd Unit 204
- 324 Russell Rd Unit 109
- 324 Russell Rd Unit 101
- 44 Kensington Ave
- 13 Furrow St
- 105 Montgomery St
Your Personal Tour Guide
Ask me questions while you tour the home.