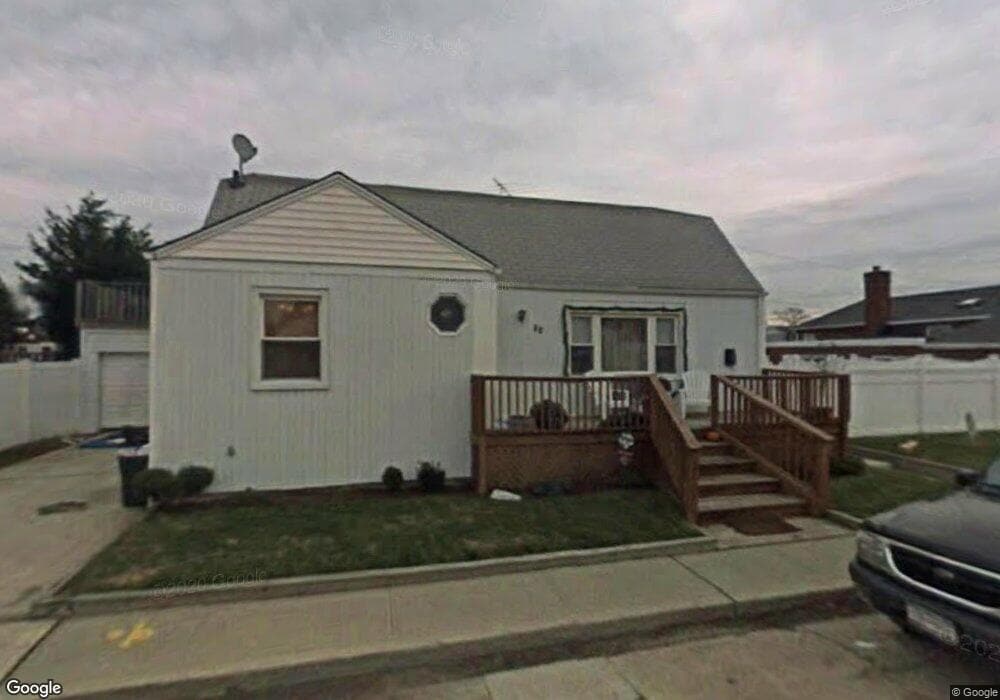
30 Boyd St Long Beach, NY 11561
Estimated Value: $880,364 - $1,368,000
Studio
1
Bath
1,583
Sq Ft
$710/Sq Ft
Est. Value
About This Home
This home is located at 30 Boyd St, Long Beach, NY 11561 and is currently estimated at $1,124,182, approximately $710 per square foot. 30 Boyd St is a home located in Nassau County with nearby schools including Lido Elementary School, East Elementary School, and Lindell Elementary School.
Ownership History
Date
Name
Owned For
Owner Type
Purchase Details
Closed on
Jun 30, 2010
Sold by
Rossetti Robert and Koehler Rossetti Dawn
Bought by
Difusco Joseph
Current Estimated Value
Home Financials for this Owner
Home Financials are based on the most recent Mortgage that was taken out on this home.
Original Mortgage
$426,350
Outstanding Balance
$285,432
Interest Rate
4.87%
Mortgage Type
FHA
Estimated Equity
$838,750
Purchase Details
Closed on
May 21, 2002
Sold by
Rosetti Frank
Bought by
Frank Rossetti
Create a Home Valuation Report for This Property
The Home Valuation Report is an in-depth analysis detailing your home's value as well as a comparison with similar homes in the area
Home Values in the Area
Average Home Value in this Area
Purchase History
We collect this data history from publicly available records. To have your information removed, we recommend requesting removal directly through your county’s website.
| Date | Buyer | Sale Price | Title Company |
|---|---|---|---|
| Difusco Joseph | $436,000 | -- | |
| Frank Rossetti | $140,000 | -- |
Source: Public Records
Mortgage History
We collect this data history from publicly available records. To have your information removed, we recommend requesting removal directly through your county’s website.
| Date | Status | Borrower | Loan Amount |
|---|---|---|---|
| Open | Difusco Joseph | $426,350 |
Source: Public Records
Tax History
| Year | Tax Paid | Tax Assessment Tax Assessment Total Assessment is a certain percentage of the fair market value that is determined by local assessors to be the total taxable value of land and additions on the property. | Land | Improvement |
|---|---|---|---|---|
| 2025 | $9,359 | $650 | $270 | $380 |
| 2024 | $1,156 | $652 | $271 | $381 |
| 2023 | $9,077 | $675 | $281 | $394 |
| 2022 | $9,077 | $679 | $282 | $397 |
| 2021 | $18,369 | $695 | $273 | $422 |
| 2020 | $14,381 | $1,032 | $866 | $166 |
| 2019 | $8,840 | $1,083 | $977 | $106 |
| 2018 | $8,755 | $981 | $0 | $0 |
| 2017 | $6,416 | $1,090 | $977 | $113 |
| 2016 | $1,346 | $1,090 | $977 | $113 |
| 2015 | $1,338 | $1,090 | $977 | $113 |
| 2014 | $1,338 | $1,090 | $977 | $113 |
| 2013 | $960 | $818 | $733 | $85 |
Source: Public Records
Map
Nearby Homes
Your Personal Tour Guide
Ask me questions while you tour the home.