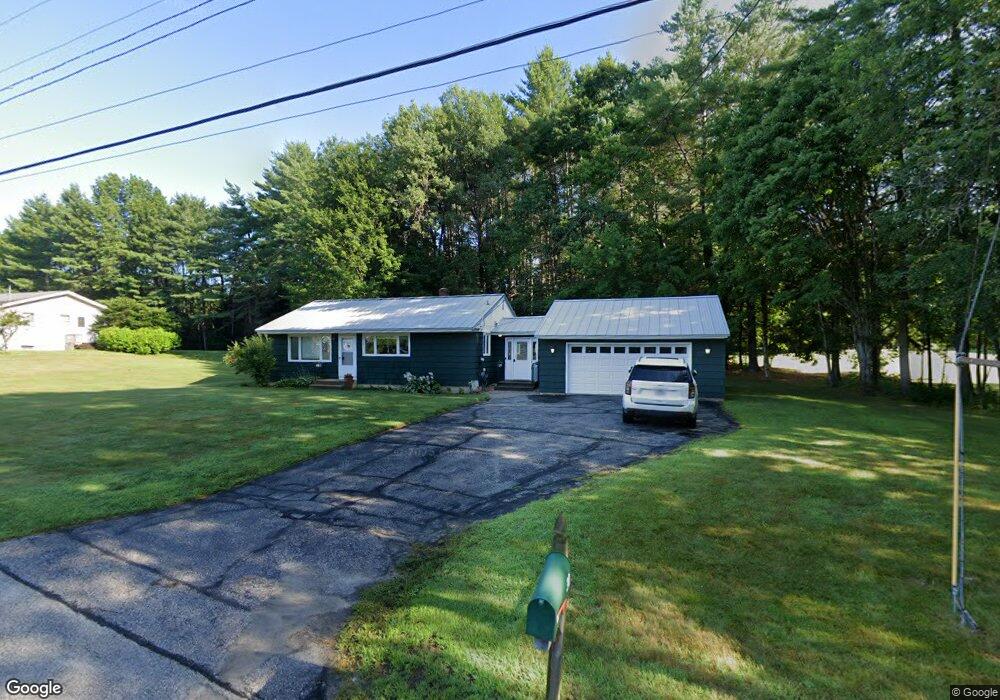
30 Carson St Auburn, ME 04210
Estimated Value: $268,000 - $305,648
2
Beds
2
Baths
988
Sq Ft
$292/Sq Ft
Est. Value
About This Home
This home is located at 30 Carson St, Auburn, ME 04210 and is currently estimated at $288,912, approximately $292 per square foot. 30 Carson St is a home located in Androscoggin County with nearby schools including Fairview School, Auburn Middle School, and Edward Little High School.
Ownership History
Date
Name
Owned For
Owner Type
Purchase Details
Closed on
Aug 16, 2024
Sold by
Simpson Christopher T
Bought by
Megan M Freitas T M and Megan Freitas
Current Estimated Value
Purchase Details
Closed on
Jan 24, 2020
Sold by
Hybrid Investments Llc
Bought by
Simpson Christopher T
Home Financials for this Owner
Home Financials are based on the most recent Mortgage that was taken out on this home.
Original Mortgage
$96,000
Interest Rate
3.7%
Mortgage Type
New Conventional
Purchase Details
Closed on
Nov 19, 2007
Sold by
Olstein Sheri
Bought by
Hybrid Investments Llc
Create a Home Valuation Report for This Property
The Home Valuation Report is an in-depth analysis detailing your home's value as well as a comparison with similar homes in the area
Home Values in the Area
Average Home Value in this Area
Purchase History
| Date | Buyer | Sale Price | Title Company |
|---|---|---|---|
| Megan M Freitas T M | $295,000 | None Available | |
| Megan M Freitas T M | $295,000 | None Available | |
| Simpson Christopher T | -- | None Available | |
| Simpson Christopher T | -- | None Available | |
| Hybrid Investments Llc | -- | -- | |
| Hybrid Investments Llc | -- | -- |
Source: Public Records
Mortgage History
| Date | Status | Borrower | Loan Amount |
|---|---|---|---|
| Previous Owner | Simpson Christopher T | $96,000 |
Source: Public Records
Tax History
| Year | Tax Paid | Tax Assessment Tax Assessment Total Assessment is a certain percentage of the fair market value that is determined by local assessors to be the total taxable value of land and additions on the property. | Land | Improvement |
|---|---|---|---|---|
| 2025 | $4,647 | $203,100 | $42,700 | $160,400 |
| 2024 | $4,519 | $203,100 | $42,700 | $160,400 |
| 2023 | $4,106 | $180,500 | $37,900 | $142,600 |
| 2022 | $4,106 | $180,500 | $37,900 | $142,600 |
| 2021 | $3,585 | $150,500 | $31,600 | $118,900 |
| 2020 | $3,574 | $150,500 | $31,600 | $118,900 |
| 2019 | $3,574 | $150,500 | $31,600 | $118,900 |
| 2018 | $3,564 | $150,500 | $31,600 | $118,900 |
| 2017 | $3,460 | $150,500 | $31,600 | $118,900 |
| 2016 | $3,364 | $150,500 | $31,600 | $118,900 |
| 2015 | $3,198 | $150,500 | $31,600 | $118,900 |
| 2013 | -- | $150,500 | $31,600 | $118,900 |
Source: Public Records
Map
Nearby Homes
Your Personal Tour Guide
Ask me questions while you tour the home.