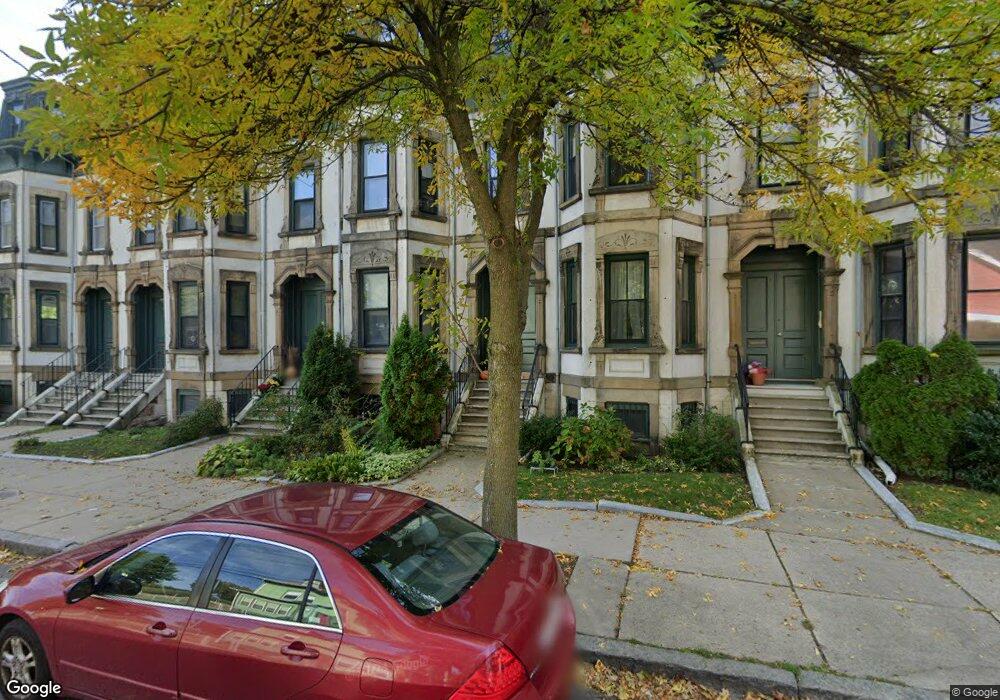
30 Cedar St Unit 2 Roxbury, MA 02119
Fort Hill NeighborhoodEstimated Value: $446,000 - $609,000
3
Beds
2
Baths
9,999
Sq Ft
$51/Sq Ft
Est. Value
About This Home
This home is located at 30 Cedar St Unit 2, Roxbury, MA 02119 and is currently estimated at $511,098, approximately $51 per square foot. 30 Cedar St Unit 2 is a home located in Suffolk County with nearby schools including City on a Hill Charter Public School and Paige Academy.
Ownership History
Date
Name
Owned For
Owner Type
Purchase Details
Closed on
Mar 27, 1995
Sold by
Mhfa
Bought by
Osborne-Weeks Juel E
Current Estimated Value
Home Financials for this Owner
Home Financials are based on the most recent Mortgage that was taken out on this home.
Original Mortgage
$22,500
Interest Rate
8.78%
Mortgage Type
Purchase Money Mortgage
Purchase Details
Closed on
Jan 25, 1994
Sold by
Best Dolrudee
Bought by
Mhfa
Purchase Details
Closed on
Mar 11, 1987
Sold by
Urban Edge Dev Tr
Bought by
Best Dolrudee
Home Financials for this Owner
Home Financials are based on the most recent Mortgage that was taken out on this home.
Original Mortgage
$36,800
Interest Rate
9.01%
Mortgage Type
Purchase Money Mortgage
Create a Home Valuation Report for This Property
The Home Valuation Report is an in-depth analysis detailing your home's value as well as a comparison with similar homes in the area
Home Values in the Area
Average Home Value in this Area
Purchase History
| Date | Buyer | Sale Price | Title Company |
|---|---|---|---|
| Osborne-Weeks Juel E | $30,000 | -- | |
| Mhfa | $24,650 | -- | |
| Best Dolrudee | $46,000 | -- |
Source: Public Records
Mortgage History
| Date | Status | Borrower | Loan Amount |
|---|---|---|---|
| Open | Best Dolrudee | $150,000 | |
| Closed | Best Dolrudee | $22,500 | |
| Previous Owner | Best Dolrudee | $36,800 | |
| Closed | Best Dolrudee | $6,000 |
Source: Public Records
Property History
| Date | Event | Price | List to Sale | Price per Sq Ft |
|---|---|---|---|---|
| 05/18/2025 05/18/25 | Off Market | $3,200 | -- | -- |
| 05/07/2025 05/07/25 | For Rent | $3,200 | -- | -- |
Tax History
| Year | Tax Paid | Tax Assessment Tax Assessment Total Assessment is a certain percentage of the fair market value that is determined by local assessors to be the total taxable value of land and additions on the property. | Land | Improvement |
|---|---|---|---|---|
| 2025 | $4,942 | $426,800 | $0 | $426,800 |
| 2024 | $4,742 | $435,000 | $0 | $435,000 |
| 2023 | $4,533 | $422,100 | $0 | $422,100 |
| 2022 | $4,374 | $402,000 | $0 | $402,000 |
| 2021 | $4,289 | $402,000 | $0 | $402,000 |
| 2020 | $3,787 | $358,600 | $0 | $358,600 |
| 2019 | $3,499 | $332,000 | $0 | $332,000 |
| 2018 | $3,224 | $307,600 | $0 | $307,600 |
| 2017 | $3,043 | $287,300 | $0 | $287,300 |
| 2016 | $2,927 | $266,100 | $0 | $266,100 |
| 2015 | $3,034 | $250,500 | $0 | $250,500 |
| 2014 | $2,888 | $229,600 | $0 | $229,600 |
Source: Public Records
Map
Nearby Homes
- 16 Hawthorne St
- 9 W Cedar St
- 39 Hawthorne St Unit 39
- 156-160 Highland St Unit 156
- 187 Highland St
- 10 Linwood St
- 6 Millmont St Unit 6
- 5 Valentine St Unit 1
- 64 Alpine St Unit 104
- 64 Alpine St Unit 304
- 51 Vale St Unit 1
- 27 Dudley St
- 10-18 John Eliot Square Unit 3D
- 78 Fort Ave Unit 78
- 21 Marcella St Unit 2
- 21 Marcella St
- 27 Saint James St
- 2856 Washington St
- 16 Mayfair St
- 48-50 Dudley St
- 28 Cedar St Unit 2
- 28 Cedar St Unit 1
- 30 Cedar St Unit 1
- 32 Cedar St Unit 2
- 32 Cedar St Unit 1
- 34 Cedar St Unit 2
- 34 Cedar St Unit 1
- 38 Cedar St Unit 2
- 38 Cedar St Unit 1
- 36 Cedar St Unit 2
- 36 Cedar St Unit 1
- 75 Thornton St
- 22 Cedar St
- 22-24 Cedar St
- 22 Cedar St Unit 2
- 40 Cedar St Unit 2
- 40 Cedar St Unit 1
- 42 Cedar St
- 20 Cedar St
- 44 Cedar St
Your Personal Tour Guide
Ask me questions while you tour the home.