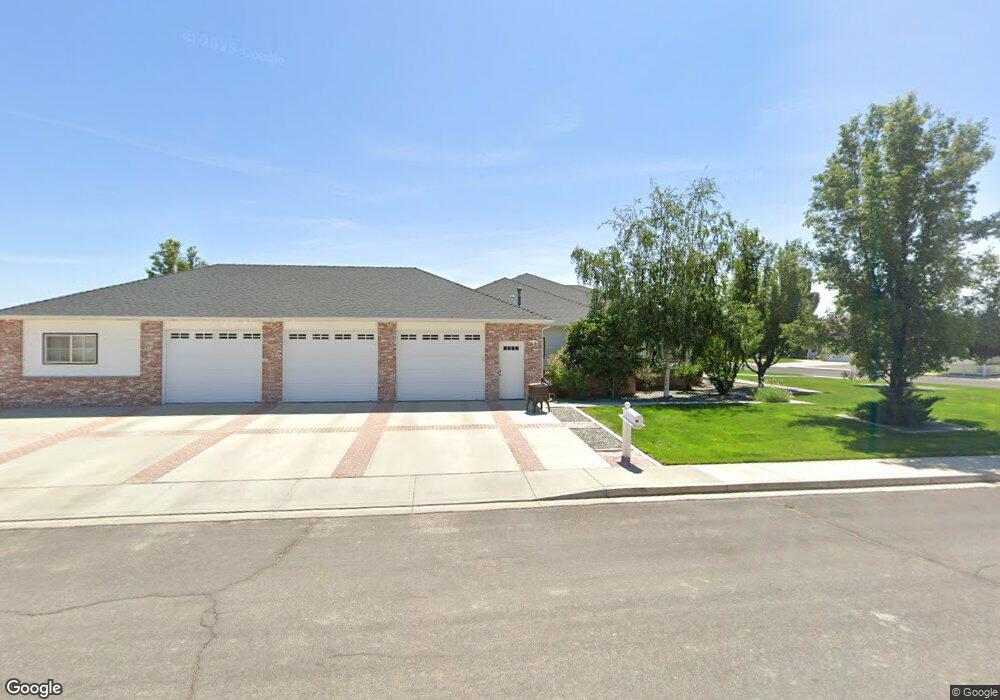
30 Jacobs Rd Yerington, NV 89447
Estimated Value: $564,444 - $668,000
3
Beds
3
Baths
2,664
Sq Ft
$227/Sq Ft
Est. Value
About This Home
This home is located at 30 Jacobs Rd, Yerington, NV 89447 and is currently estimated at $604,611, approximately $226 per square foot. 30 Jacobs Rd is a home located in Lyon County with nearby schools including Yerington Elementary School, Yerington Intermediate School, and Yerington High School.
Ownership History
Date
Name
Owned For
Owner Type
Purchase Details
Closed on
May 26, 2006
Sold by
Smith Robert J and Smith Nancy M
Bought by
Cooper Robert L and Kingsley Cooper Heather A
Current Estimated Value
Home Financials for this Owner
Home Financials are based on the most recent Mortgage that was taken out on this home.
Original Mortgage
$415,000
Outstanding Balance
$243,713
Interest Rate
6.55%
Mortgage Type
Seller Take Back
Estimated Equity
$360,898
Purchase Details
Closed on
Oct 3, 2005
Sold by
Smith Robert J and Smith Nancy
Bought by
Robert J and Smith Nancy N
Create a Home Valuation Report for This Property
The Home Valuation Report is an in-depth analysis detailing your home's value as well as a comparison with similar homes in the area
Home Values in the Area
Average Home Value in this Area
Purchase History
| Date | Buyer | Sale Price | Title Company |
|---|---|---|---|
| Cooper Robert L | $490,000 | Title Service & Escrow Co | |
| Robert J | -- | None Available |
Source: Public Records
Mortgage History
| Date | Status | Borrower | Loan Amount |
|---|---|---|---|
| Open | Cooper Robert L | $415,000 |
Source: Public Records
Tax History
| Year | Tax Paid | Tax Assessment Tax Assessment Total Assessment is a certain percentage of the fair market value that is determined by local assessors to be the total taxable value of land and additions on the property. | Land | Improvement |
|---|---|---|---|---|
| 2025 | $4,169 | $154,395 | $33,250 | $121,145 |
| 2024 | $4,049 | $155,115 | $33,250 | $121,864 |
| 2023 | $4,049 | $145,823 | $31,500 | $114,323 |
| 2022 | $3,803 | $120,745 | $15,750 | $104,995 |
| 2021 | $3,687 | $111,769 | $9,275 | $102,494 |
| 2020 | $3,580 | $108,265 | $9,280 | $98,985 |
| 2019 | $3,476 | $104,898 | $9,280 | $95,618 |
| 2018 | $3,375 | $102,572 | $9,280 | $93,292 |
| 2017 | $3,277 | $102,638 | $9,280 | $93,358 |
| 2016 | $3,194 | $105,317 | $9,280 | $96,037 |
| 2015 | $3,188 | $88,200 | $9,280 | $78,920 |
| 2014 | $3,095 | $83,650 | $9,280 | $74,370 |
Source: Public Records
Map
Nearby Homes
Your Personal Tour Guide
Ask me questions while you tour the home.