30 Kinney Ct Stoughton, MA 02072
Estimated Value: $848,000 - $1,202,000
About This Home
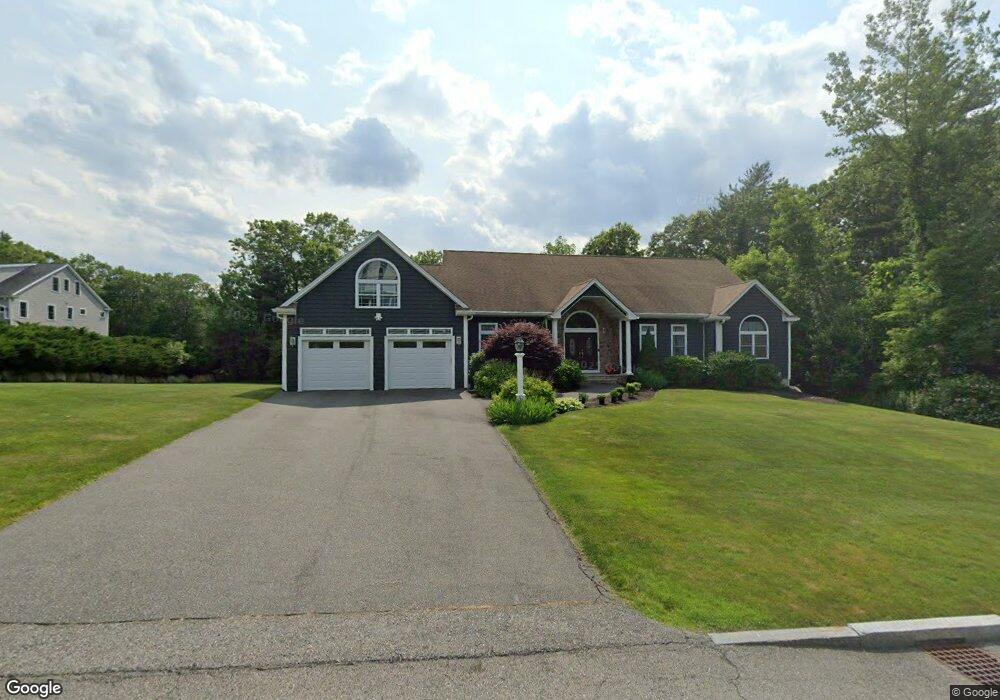
This home is located at 30 Kinney Ct, Stoughton, MA 02072 and is currently estimated at $1,048,275, approximately $298 per square foot. 30 Kinney Ct is a home located in Norfolk County with nearby schools including Joseph H. Gibbons Elementary School, O'Donnell Middle School, and Stoughton High School.
Ownership History
We collect this data history from publicly available records. To have your information removed, we recommend requesting removal directly through your county’s website.
Purchase Details
Purchase Details
Home Values in the Area
Average Home Value in this Area
Purchase History
We collect this data history from publicly available records. To have your information removed, we recommend requesting removal directly through your county’s website.
| Date | Buyer | Sale Price | Title Company |
|---|---|---|---|
| -- | None Available | ||
| -- | None Available | ||
| $250,000 | -- | ||
| $250,000 | -- | ||
| $250,000 | -- |
Mortgage History
We collect this data history from publicly available records. To have your information removed, we recommend requesting removal directly through your county’s website.
| Date | Status | Borrower | Loan Amount |
|---|---|---|---|
| Previous Owner | $326,150 |
Tax History
We collect this data history from publicly available records. To have your information removed, we recommend requesting removal directly through your county’s website.
| Year | Tax Paid | Tax Assessment Tax Assessment Total Assessment is a certain percentage of the fair market value that is determined by local assessors to be the total taxable value of land and additions on the property. | Land | Improvement |
|---|---|---|---|---|
| 2025 | $11,633 | $939,700 | $299,100 | $640,600 |
| 2024 | $11,550 | $907,300 | $273,600 | $633,700 |
| 2023 | $10,882 | $803,100 | $231,200 | $571,900 |
| 2022 | $10,119 | $702,200 | $201,400 | $500,800 |
| 2021 | $10,455 | $692,400 | $203,100 | $489,300 |
| 2020 | $10,310 | $692,400 | $203,100 | $489,300 |
| 2019 | $9,969 | $649,900 | $203,100 | $446,800 |
| 2018 | $9,084 | $613,400 | $207,600 | $405,800 |
| 2017 | $8,726 | $602,200 | $207,600 | $394,600 |
| 2016 | $8,440 | $563,800 | $203,100 | $360,700 |
| 2015 | $8,452 | $558,600 | $198,600 | $360,000 |
| 2014 | $8,204 | $521,200 | $198,600 | $322,600 |
Map
- 1600 West St
- 9 Riverside Terrace
- 54 Ross Ave
- 115 Kennedy Rd
- 9 Highland St
- 5 Eagle Rock Rd
- 78 Bird St
- 61 Canton St
- 7 Dry Pond Rd
- 23 Dutton Rd
- 43 Gilbert Dr
- 70 Washington St
- 22 Flyaway Pond Dr
- 29 Canton St
- 91 Washington St
- 21 Canton St
- 42 Eisenhower Dr
- 22 Kwedar Ave
- 201 Atkinson Ave
- 10 Clara Howard Way
Ask me questions while you tour the home.