30 Lyman Rd Framingham, MA 01701
Nobscot NeighborhoodEstimated Value: $658,000 - $734,000
About This Home
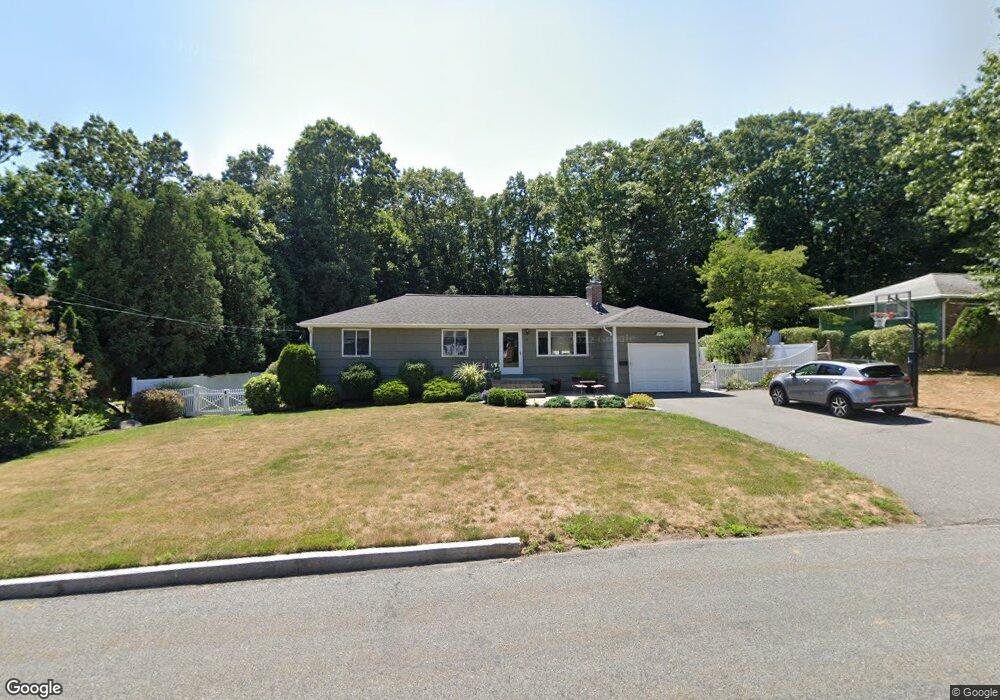
This home is located at 30 Lyman Rd, Framingham, MA 01701 and is currently estimated at $695,827, approximately $422 per square foot. 30 Lyman Rd is a home located in Middlesex County with nearby schools including Framingham High School, MetroWest Jewish Day School, and Sudbury Valley School.
Ownership History
We collect this data history from publicly available records. To have your information removed, we recommend requesting removal directly through your county’s website.
Purchase Details
Home Financials for this Owner
Home Financials are based on the most recent Mortgage that was taken out on this home.Home Values in the Area
Average Home Value in this Area
Purchase History
We collect this data history from publicly available records. To have your information removed, we recommend requesting removal directly through your county’s website.
| Date | Buyer | Sale Price | Title Company |
|---|---|---|---|
| $173,500 | -- | ||
| $173,500 | -- |
Mortgage History
We collect this data history from publicly available records. To have your information removed, we recommend requesting removal directly through your county’s website.
| Date | Status | Borrower | Loan Amount |
|---|---|---|---|
| Open | $18,000 | ||
| Open | $43,500 | ||
| Closed | $25,000 |
Tax History
We collect this data history from publicly available records. To have your information removed, we recommend requesting removal directly through your county’s website.
| Year | Tax Paid | Tax Assessment Tax Assessment Total Assessment is a certain percentage of the fair market value that is determined by local assessors to be the total taxable value of land and additions on the property. | Land | Improvement |
|---|---|---|---|---|
| 2025 | $7,144 | $598,300 | $271,100 | $327,200 |
| 2024 | $6,818 | $547,200 | $242,200 | $305,000 |
| 2023 | $6,383 | $487,600 | $216,100 | $271,500 |
| 2022 | $6,046 | $440,000 | $196,100 | $243,900 |
| 2021 | $5,908 | $420,500 | $188,500 | $232,000 |
| 2020 | $5,950 | $397,200 | $171,300 | $225,900 |
| 2019 | $5,871 | $381,700 | $171,300 | $210,400 |
| 2018 | $5,772 | $353,700 | $164,900 | $188,800 |
| 2017 | $5,650 | $338,100 | $160,100 | $178,000 |
| 2016 | $5,516 | $317,400 | $160,100 | $157,300 |
| 2015 | $5,592 | $313,800 | $160,600 | $153,200 |
Map
- 576 Grove St
- 616 Grove St
- 2 Whiting Rd
- 477 Edgell Rd
- 301 Winch St
- 7 Blueberry Cir
- 1207 Windsor Dr
- 915 Edgell Rd Unit 61
- 2005 Windsor Dr Unit 2005
- 32 Hawk Ln Unit 48
- 11 Baiting Brook Rd Unit 11
- 51 Higgins Rd
- 140 Winch St
- 187 Mill St
- 94 Spruce St
- 2 Hemenway Rd
- 2 Millwood Cir
- 258 Edgell Rd
- 14 Clearview Dr
- 29 Little Tree Ln
Ask me questions while you tour the home.