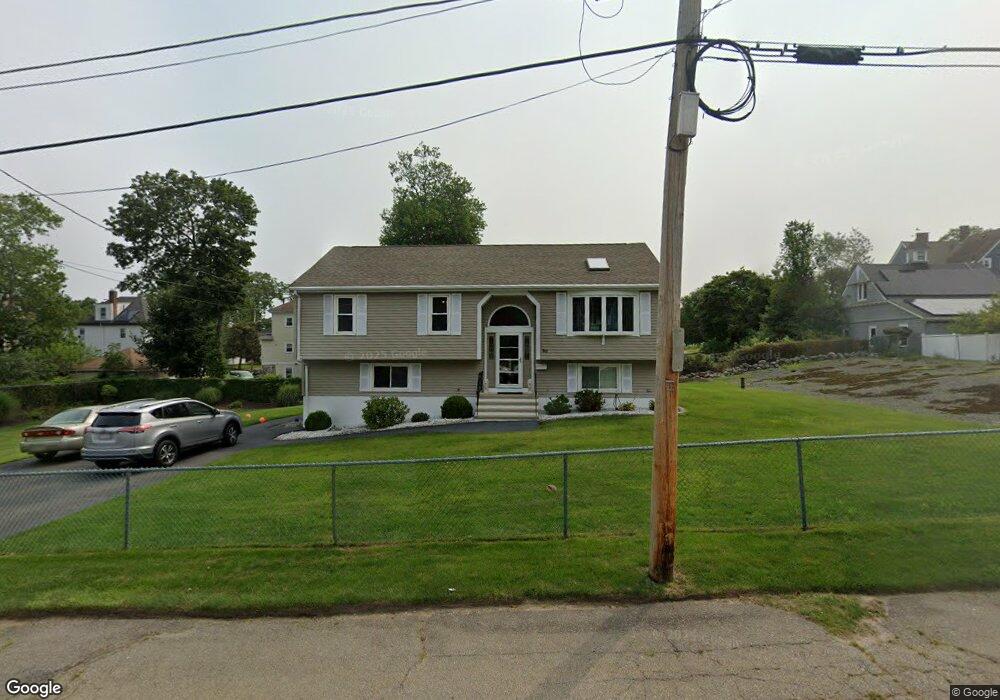
30 Maxim St Brockton, MA 02301
Estimated Value: $538,151 - $591,000
3
Beds
1
Bath
1,658
Sq Ft
$333/Sq Ft
Est. Value
About This Home
This home is located at 30 Maxim St, Brockton, MA 02301 and is currently estimated at $552,038, approximately $332 per square foot. 30 Maxim St is a home located in Plymouth County with nearby schools including Manthala George Jr. School, Louis F Angelo Elementary School, and Raymond K-8 Elementary School.
Ownership History
Date
Name
Owned For
Owner Type
Purchase Details
Closed on
Dec 2, 1997
Sold by
Toan Rt
Bought by
Annese Bldrs Inc
Current Estimated Value
Create a Home Valuation Report for This Property
The Home Valuation Report is an in-depth analysis detailing your home's value as well as a comparison with similar homes in the area
Purchase History
| Date | Buyer | Sale Price | Title Company |
|---|---|---|---|
| Annese Bldrs Inc | $29,000 | -- |
Source: Public Records
Mortgage History
| Date | Status | Borrower | Loan Amount |
|---|---|---|---|
| Open | Annese Bldrs Inc | $116,811 | |
| Closed | Annese Bldrs Inc | $170,000 | |
| Closed | Annese Bldrs Inc | $39,800 |
Source: Public Records
Tax History
| Year | Tax Paid | Tax Assessment Tax Assessment Total Assessment is a certain percentage of the fair market value that is determined by local assessors to be the total taxable value of land and additions on the property. | Land | Improvement |
|---|---|---|---|---|
| 2025 | $5,945 | $490,900 | $151,000 | $339,900 |
| 2024 | $5,883 | $489,400 | $151,000 | $338,400 |
| 2023 | $5,835 | $449,500 | $116,400 | $333,100 |
| 2022 | $5,567 | $398,500 | $106,000 | $292,500 |
| 2021 | $5,016 | $345,900 | $98,800 | $247,100 |
| 2020 | $5,025 | $331,700 | $94,600 | $237,100 |
| 2019 | $4,954 | $318,800 | $88,600 | $230,200 |
| 2018 | $4,620 | $287,700 | $88,600 | $199,100 |
| 2017 | $4,176 | $259,400 | $88,600 | $170,800 |
| 2016 | $4,652 | $268,000 | $84,800 | $183,200 |
| 2015 | $4,450 | $245,200 | $84,800 | $160,400 |
| 2014 | $4,607 | $254,100 | $84,800 | $169,300 |
Source: Public Records
Map
Nearby Homes
- 131 Moraine St
- 69 W Elm Terrace Unit 1
- 47 N Belcher Ave
- 425 W Elm St Unit 7
- 109 Lenox St
- 24 N Byron Ave
- 436 Pleasant St
- 77 Highland Terrace
- 48 Simmons Ave
- 16 Palmer St
- 193 Boylston St
- 18 Belmont Place
- 282 Belmont St
- 75 Colonel Bell Dr Unit 77-11
- 66 Cross Ave
- 65 Cross Ave
- 81 Colonel Bell Dr Unit 9
- 39 Grafton St
- 189 Pleasant St
- 97 Colonel Bell Dr Unit 8
- 123 Moraine St
- 20 Maxim St
- 27 Maxim St
- 141 Moraine St
- 33 Maxim St
- 0 Lot E6 Maxim St Unit 50299439
- 21 Maxim St
- 115 Moraine St
- 18 Sycamore St
- 16 Sycamore St
- 107 Moraine St
- 107 Moraine St Unit 3
- 105 Moraine St Unit 3
- 105 Moraine St
- 26 Sycamore St
- 118 Moraine St
- 4 Sycamore St
- 39 Maxim St
- 30 Sycamore St
- 12 N Doris Ave
Your Personal Tour Guide
Ask me questions while you tour the home.