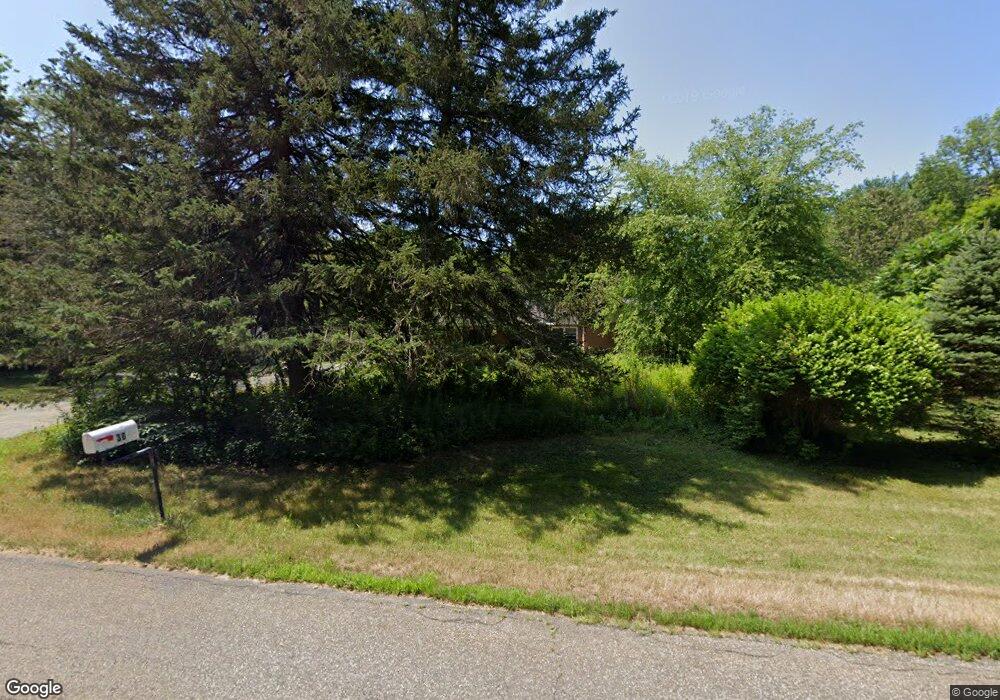
30 Pine St Columbia, CT 06237
Estimated Value: $359,031 - $463,000
4
Beds
3
Baths
1,909
Sq Ft
$213/Sq Ft
Est. Value
About This Home
This home is located at 30 Pine St, Columbia, CT 06237 and is currently estimated at $406,508, approximately $212 per square foot. 30 Pine St is a home located in Tolland County with nearby schools including Horace W. Porter School.
Ownership History
Date
Name
Owned For
Owner Type
Purchase Details
Closed on
Jan 26, 2024
Sold by
Saucier Alexis R
Bought by
Saucier Flt and Saucier S
Current Estimated Value
Purchase Details
Closed on
Sep 6, 1996
Sold by
Petrus John
Bought by
Saucier Leroy and Saucier Linda
Create a Home Valuation Report for This Property
The Home Valuation Report is an in-depth analysis detailing your home's value as well as a comparison with similar homes in the area
Home Values in the Area
Average Home Value in this Area
Purchase History
We collect this data history from publicly available records. To have your information removed, we recommend requesting removal directly through your county’s website.
| Date | Buyer | Sale Price | Title Company |
|---|---|---|---|
| Saucier Flt | -- | None Available | |
| Saucier Alexis R | -- | None Available | |
| Saucier Flt | -- | None Available | |
| Saucier Linda J | -- | None Available | |
| Saucier Linda J | -- | None Available | |
| Saucier Leroy | $100,606 | -- | |
| Saucier Leroy | $100,606 | -- |
Source: Public Records
Mortgage History
We collect this data history from publicly available records. To have your information removed, we recommend requesting removal directly through your county’s website.
| Date | Status | Borrower | Loan Amount |
|---|---|---|---|
| Previous Owner | Saucier Leroy | $161,048 | |
| Previous Owner | Saucier Leroy | $175,000 | |
| Previous Owner | Saucier Leroy | $164,000 |
Source: Public Records
Tax History
| Year | Tax Paid | Tax Assessment Tax Assessment Total Assessment is a certain percentage of the fair market value that is determined by local assessors to be the total taxable value of land and additions on the property. | Land | Improvement |
|---|---|---|---|---|
| 2025 | $4,975 | $169,960 | $42,700 | $127,260 |
| 2024 | $4,779 | $169,960 | $42,700 | $127,260 |
| 2023 | $4,404 | $169,960 | $42,700 | $127,260 |
| 2022 | $4,397 | $169,960 | $42,700 | $127,260 |
| 2021 | $4,400 | $150,000 | $42,800 | $107,200 |
| 2020 | $7,228 | $150,000 | $42,800 | $107,200 |
| 2019 | $7,228 | $150,000 | $42,800 | $107,200 |
| 2018 | $7,228 | $150,000 | $42,800 | $107,200 |
| 2017 | $4,332 | $150,000 | $42,800 | $107,200 |
| 2016 | $4,003 | $145,900 | $42,800 | $103,100 |
| 2015 | $3,958 | $145,900 | $42,800 | $103,100 |
| 2014 | $3,958 | $145,900 | $42,800 | $103,100 |
Source: Public Records
Map
Nearby Homes
Your Personal Tour Guide
Ask me questions while you tour the home.