

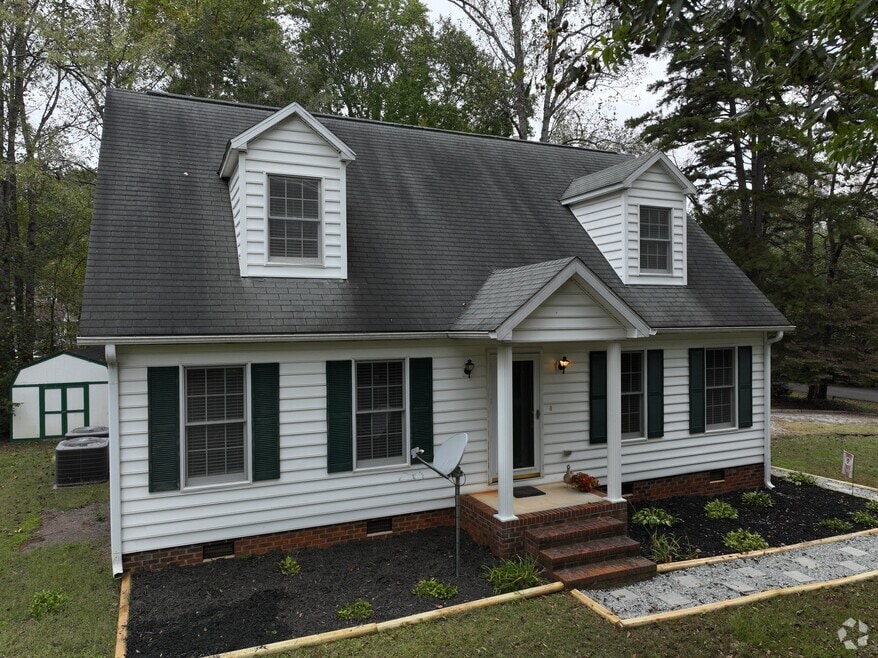


30 Shannon Ct Timberlake, NC 27583
Estimated payment $1,894/month
Total Views
2,292
3
Beds
2.5
Baths
1,681
Sq Ft
$193
Price per Sq Ft
Highlights
- Cape Cod Architecture
- No HOA
- Tile Flooring
- Main Floor Primary Bedroom
- Soaking Tub
- Forced Air Heating and Cooling System
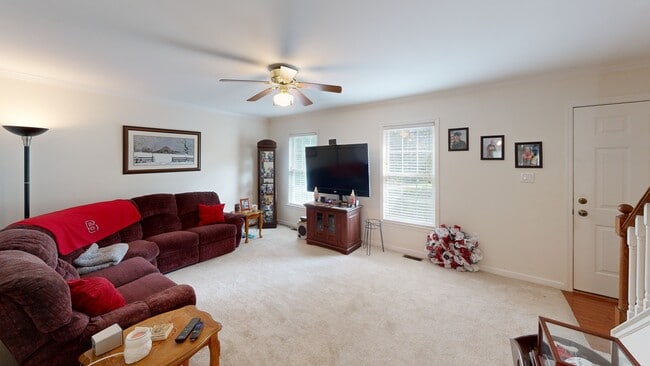
About This Home
Welcome home to this charming Cape Cod! With ground floor living and two huge bedrooms upstairs, this home lives REALLY big. Send the kids upstairs or use the upper as a bonus space but either way, you can certainly stretch your legs here! This home boasts a large master suite with soaking tub, walk-in shower and walk-in closet. Oversized deck is just off of the kitchen and you could fit a whole party on that deck! Overlooking your VERY private backyard with mature trees and a corner lot. A nice outbuilding for all of your needs and all of this is sitting on 1.23 acres! Whole house paint job, new countertops, new WH and both HVAC units replaced with in the past 5 years. Pre listing inspection done and repairs made :)
Home Details
Home Type
- Single Family
Est. Annual Taxes
- $1,711
Year Built
- Built in 1996
Lot Details
- 1.23 Acre Lot
Home Design
- Cape Cod Architecture
- Brick Exterior Construction
- Frame Construction
- Shingle Roof
- Asphalt Roof
- Vinyl Siding
Interior Spaces
- 1,681 Sq Ft Home
- 1.5-Story Property
- Ceiling Fan
Kitchen
- Electric Cooktop
- Microwave
- Dishwasher
Flooring
- Carpet
- Laminate
- Tile
Bedrooms and Bathrooms
- 3 Bedrooms
- Primary Bedroom on Main
- Soaking Tub
Schools
- Helena Elementary School
- Southern Middle School
- Person High School
Utilities
- Forced Air Heating and Cooling System
- Heat Pump System
- Private Water Source
- Well
- Septic Tank
- Septic System
- Private Sewer
Community Details
- No Home Owners Association
- River Trace Subdivision
Listing and Financial Details
- Assessor Parcel Number 20519
3D Interior and Exterior Tours
Floorplans
Map
Create a Home Valuation Report for This Property
The Home Valuation Report is an in-depth analysis detailing your home's value as well as a comparison with similar homes in the area
Tax History
| Year | Tax Paid | Tax Assessment Tax Assessment Total Assessment is a certain percentage of the fair market value that is determined by local assessors to be the total taxable value of land and additions on the property. | Land | Improvement |
|---|---|---|---|---|
| 2025 | $1,711 | $253,026 | $0 | $0 |
| 2024 | $1,463 | $187,258 | $0 | $0 |
| 2023 | $1,463 | $187,258 | $0 | $0 |
| 2022 | $1,458 | $187,258 | $0 | $0 |
| 2021 | $1,416 | $187,258 | $0 | $0 |
| 2020 | $1,148 | $151,394 | $0 | $0 |
| 2019 | $1,163 | $151,394 | $0 | $0 |
| 2018 | $1,091 | $151,394 | $0 | $0 |
| 2017 | $1,076 | $151,380 | $0 | $0 |
| 2016 | $1,076 | $151,380 | $0 | $0 |
| 2015 | $1,076 | $151,380 | $0 | $0 |
| 2014 | $1,076 | $151,380 | $0 | $0 |
Source: Public Records
Property History
| Date | Event | Price | List to Sale | Price per Sq Ft |
|---|---|---|---|---|
| 03/30/2026 03/30/26 | Pending | -- | -- | -- |
| 03/27/2026 03/27/26 | For Sale | $325,000 | -- | $193 / Sq Ft |
Source: Doorify MLS
Purchase History
| Date | Type | Sale Price | Title Company |
|---|---|---|---|
| Warranty Deed | $159,000 | -- |
Source: Public Records
Mortgage History
| Date | Status | Loan Amount | Loan Type |
|---|---|---|---|
| Open | $121,952 | Adjustable Rate Mortgage/ARM |
Source: Public Records
About the Listing Agent
I am a full-time Agent with the Hillsborough and Mebane office's. I was born and raised in the Triad area. I have been married for 14 years to an amazing woman who has completed multible Masters Programs, to include her Masters in Nursing Education and Family Nurse Practitioner! We moved to Mebane in early 2014 to be closer to family. It is very important to us to be close to family, and to be able to see our beautiful niece on a daily basis. We struggled for some years trying to have our
Eric's Other Listings
-
$400,000 Sold Sep 26, 2025
- 3 Beds
- 2 Baths
- 1,816 Sq Ft
- 100 Virginia Lee Ln
- Efland, NC
Beautifull home and VERY well maintained! This home boasts an open floor plan with kitchen island, breakfast seating and eat-in kitchen. Additional formal dining and walk out to a private deck! Granite tops, stainless steel appliances and laundry all nestled in the heart of the home. Split bedroom floor plan gives the master its own space away from the rest of the home! And check out that soaking
Eric Burns COLDWELL BANKER HOWARD PERRY & WALSTON
Source: Doorify MLS
MLS Number: 10155811
APN: A65-376
Disclaimer: Certain information contained herein is derived from information provided by parties other than Homes.com. All information provided is deemed reliable, but is not guaranteed to be accurate and should be independently verified.
![]() Some IDX listings have been excluded from this IDX display. Brokers make an effort to deliver accurate information, but buyers should independently verify any information on which they will rely in a transaction. The listing broker shall not be responsible for any typographical errors, misinformation, or misprints, and they shall be held totally harmless from any damages arising from reliance upon this data. This data is provided exclusively for consumers’ personal, non-commercial use. Listings marked with an icon are provided courtesy of the Doorify MLS, Inc. of North Carolina, Internet Data Exchange Database. Closed (sold) listings may have been listed and/or sold by a real estate firm other than the firm(s) featured on this website. Closed data is not available until the sale of the property is recorded in the MLS. Home sale data is not an appraisal, CMA, competitive or comparative market analysis, or home valuation of any property. Copyright 2026 Doorify MLS, Inc. of North Carolina. All rights reserved.
Some IDX listings have been excluded from this IDX display. Brokers make an effort to deliver accurate information, but buyers should independently verify any information on which they will rely in a transaction. The listing broker shall not be responsible for any typographical errors, misinformation, or misprints, and they shall be held totally harmless from any damages arising from reliance upon this data. This data is provided exclusively for consumers’ personal, non-commercial use. Listings marked with an icon are provided courtesy of the Doorify MLS, Inc. of North Carolina, Internet Data Exchange Database. Closed (sold) listings may have been listed and/or sold by a real estate firm other than the firm(s) featured on this website. Closed data is not available until the sale of the property is recorded in the MLS. Home sale data is not an appraisal, CMA, competitive or comparative market analysis, or home valuation of any property. Copyright 2026 Doorify MLS, Inc. of North Carolina. All rights reserved.
Nearby Homes
- 100 River Bend Dr
- 1366 Ned Moore Rd
- 31 River View Ct
- 235 Spruce Ct
- 714 Dick Holeman Rd
- 0 Gates Run Unit 10142959
- 10612 Durham Rd
- 128 Cardens Cove Rd
- 8580 Durham Rd
- 90 S Old Lantern Rd
- 297 Fork Junction Rd
- 171 Helena Moriah Rd
- 425 Foxcroft Dr
- 7422 Deer Crossing Rd
- Lot 3 Helena Moriah Rd
- 0 Helena Moriah Rd Unit 10149869
- Lot 2 Helena Moriah Rd
- 0 Helena Moriah Rd Unit 100554063
- 105 Misty Hollow Rd
- 512 Bacon Rd
Your Personal Tour Guide
Ask me questions while you tour the home.