30 Summer St Wakefield, MA 01880
East Side NeighborhoodEstimated Value: $695,615 - $924,000
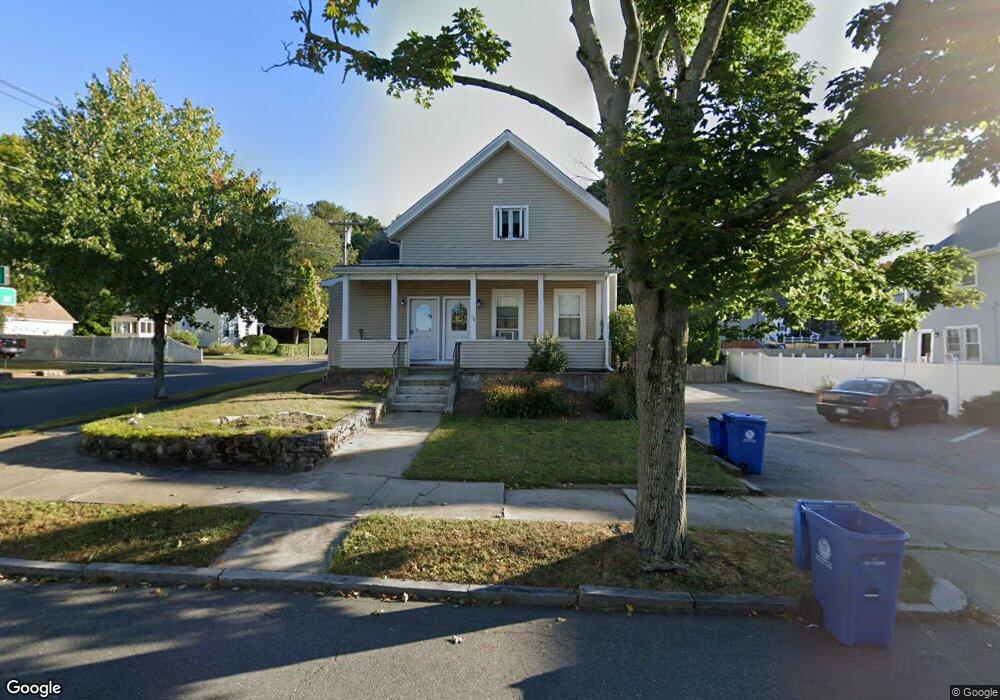
About This Home
This home is located at 30 Summer St, Wakefield, MA 01880 and is currently estimated at $814,154, approximately $308 per square foot. 30 Summer St is a home located in Middlesex County with nearby schools including Wakefield Memorial High School, St Joseph School, and Odyssey Day School.
Ownership History
We collect this data history from publicly available records. To have your information removed, we recommend requesting removal directly through your county’s website.
Purchase Details
Home Financials for this Owner
Home Financials are based on the most recent Mortgage that was taken out on this home.Home Values in the Area
Average Home Value in this Area
Purchase History
We collect this data history from publicly available records. To have your information removed, we recommend requesting removal directly through your county’s website.
| Date | Buyer | Sale Price | Title Company |
|---|---|---|---|
| $310,000 | -- | ||
| -- | -- |
Mortgage History
We collect this data history from publicly available records. To have your information removed, we recommend requesting removal directly through your county’s website.
| Date | Status | Borrower | Loan Amount |
|---|---|---|---|
| Open | $310,000 |
Tax History
We collect this data history from publicly available records. To have your information removed, we recommend requesting removal directly through your county’s website.
| Year | Tax Paid | Tax Assessment Tax Assessment Total Assessment is a certain percentage of the fair market value that is determined by local assessors to be the total taxable value of land and additions on the property. | Land | Improvement |
|---|---|---|---|---|
| 2025 | $9,174 | $808,300 | $361,000 | $447,300 |
| 2024 | $9,042 | $803,700 | $358,900 | $444,800 |
| 2023 | $8,597 | $732,900 | $327,300 | $405,600 |
| 2022 | $8,224 | $667,500 | $298,100 | $369,400 |
| 2021 | $7,726 | $606,900 | $277,900 | $329,000 |
| 2020 | $7,244 | $567,300 | $259,800 | $307,500 |
| 2019 | $6,921 | $539,400 | $247,000 | $292,400 |
| 2018 | $6,444 | $497,600 | $227,800 | $269,800 |
| 2017 | $6,059 | $465,000 | $212,900 | $252,100 |
| 2016 | $5,718 | $423,900 | $201,400 | $222,500 |
| 2015 | $5,339 | $396,100 | $188,200 | $207,900 |
| 2014 | $4,868 | $380,900 | $181,000 | $199,900 |
Map
- 1 Traverse St Unit E
- 9 Hart St
- 8 Everett St
- 61 Valley St Unit 1
- 19 Wakefield Ave
- 14 Columbia Rd
- 11 Columbia Rd Unit 8
- 4 Wakefield Ave Unit 4
- 42 Woodland Rd
- 62 Foundry St Unit 312
- 62 Foundry St Unit 315
- 62 Foundry St Unit 505
- 62 Foundry St Unit 305
- 62 Foundry St Unit 202
- 5 Ballister St Unit 523
- 175 North Ave Unit 506
- 175 North Ave Unit 407
- 18 Bartley St
- 4 Wiley Place
- 234 Water St Unit 205
- 30 Summer St Unit 2
- 30 Summer St Unit 1
- 28 Summer St
- 28 Summer St Unit 2
- 21 Birch Hill Ave
- 14 Birch Hill Ave Unit 2
- 14 Birch Hill Ave
- 14 Birch Hill Ave
- 14 Birch Hill Ave Unit 1
- 12 Birch Hill Ave
- 29 Charles St
- 26 Summer St
- 29 Summer St
- 10 Birch Hill Ave
- 10 Birch Hill Ave Unit 2
- 35 Charles St
- 27 Summer St
- 25 Charles St
- 25 Charles St Unit Charles St
- 8 Birch Hill Ave
Ask me questions while you tour the home.