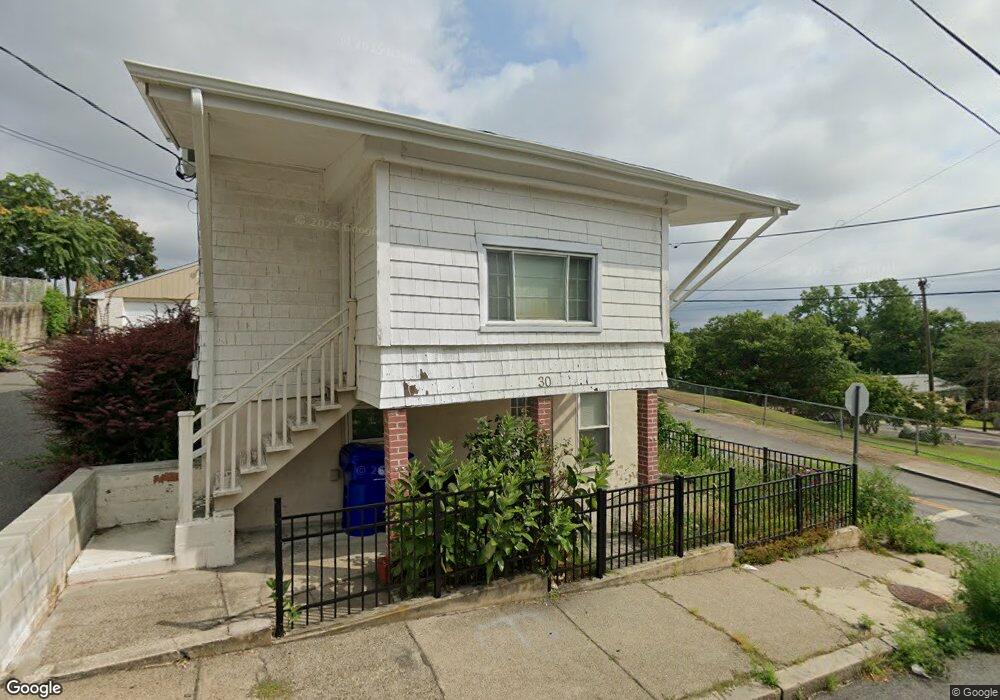
30 Tower St Pawtucket, RI 02860
Oak Hill NeighborhoodEstimated Value: $333,000 - $399,000
3
Beds
1
Bath
1,438
Sq Ft
$255/Sq Ft
Est. Value
About This Home
This home is located at 30 Tower St, Pawtucket, RI 02860 and is currently estimated at $366,844, approximately $255 per square foot. 30 Tower St is a home located in Providence County with nearby schools including International Charter School, Blackstone Academy Charter School, and Saint Raphael Academy.
Ownership History
Date
Name
Owned For
Owner Type
Purchase Details
Closed on
Oct 7, 2025
Sold by
Bonilla Wilmer and Bonilla Keri A
Bought by
Bonilla Lt and Bonilla
Current Estimated Value
Purchase Details
Closed on
Feb 19, 2003
Sold by
Londono Cesar and Londono Ana Cecillia
Bought by
Bonilla Wilmer
Home Financials for this Owner
Home Financials are based on the most recent Mortgage that was taken out on this home.
Original Mortgage
$94,000
Interest Rate
5.98%
Mortgage Type
Purchase Money Mortgage
Create a Home Valuation Report for This Property
The Home Valuation Report is an in-depth analysis detailing your home's value as well as a comparison with similar homes in the area
Home Values in the Area
Average Home Value in this Area
Purchase History
| Date | Buyer | Sale Price | Title Company |
|---|---|---|---|
| Bonilla Lt | -- | -- | |
| Bonilla Wilmer | $100,000 | -- |
Source: Public Records
Mortgage History
| Date | Status | Borrower | Loan Amount |
|---|---|---|---|
| Previous Owner | Bonilla Wilmer | $90,000 | |
| Previous Owner | Bonilla Wilmer | $115,694 | |
| Previous Owner | Bonilla Wilmer | $94,000 | |
| Previous Owner | Bonilla Wilmer | $59,000 |
Source: Public Records
Tax History
| Year | Tax Paid | Tax Assessment Tax Assessment Total Assessment is a certain percentage of the fair market value that is determined by local assessors to be the total taxable value of land and additions on the property. | Land | Improvement |
|---|---|---|---|---|
| 2025 | $3,090 | $235,000 | $106,800 | $128,200 |
| 2024 | $2,900 | $235,000 | $106,800 | $128,200 |
| 2023 | $2,987 | $176,300 | $71,200 | $105,100 |
| 2022 | $2,923 | $176,300 | $71,200 | $105,100 |
| 2021 | $2,923 | $176,300 | $71,200 | $105,100 |
| 2020 | $2,806 | $134,300 | $59,300 | $75,000 |
| 2019 | $2,806 | $134,300 | $59,300 | $75,000 |
| 2018 | $2,703 | $134,300 | $59,300 | $75,000 |
| 2017 | $2,608 | $114,800 | $60,300 | $54,500 |
| 2016 | $2,513 | $114,800 | $60,300 | $54,500 |
| 2015 | $2,513 | $114,800 | $60,300 | $54,500 |
| 2014 | $2,710 | $117,500 | $68,900 | $48,600 |
Source: Public Records
Map
Nearby Homes
- 345 Pleasant St
- 349 Pleasant St
- 51 Clifford St
- 167 George St
- 207 Pawtucket Ave
- 48 Whipple St
- 44 Pawtucket Ave
- 128 Clifford St
- 50 Jefferson Ave
- 54 Jefferson Ave
- 11 Meadow St
- 18 Dunnell Ave
- 107 Mulberry St
- 57 Garden St
- 45 Harrison St
- 95 Park Place Unit 201
- 159 Dunnell Ave
- 59 West Ave
- 126 Dunnell Ave
- 51 Wilcox Ave
Your Personal Tour Guide
Ask me questions while you tour the home.