Estimated Value: $359,000 - $410,000
3
Beds
2
Baths
1,636
Sq Ft
$241/Sq Ft
Est. Value
About This Home
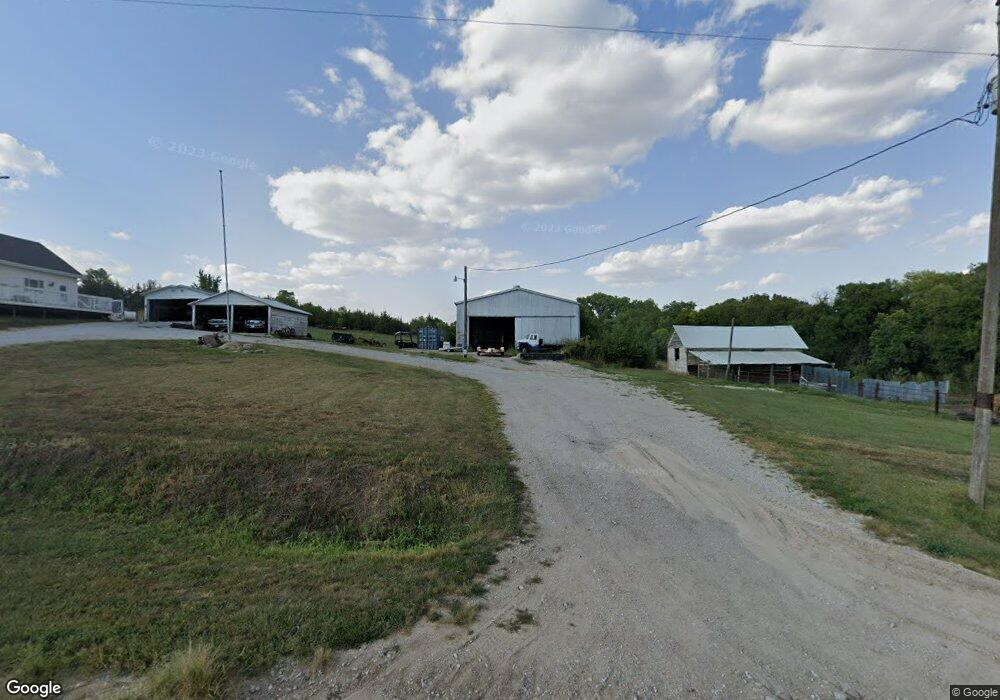
This home is located at 300 Davey Rd, Davey, NE 68336 and is currently estimated at $393,718, approximately $240 per square foot. 300 Davey Rd is a home located in Lancaster County with nearby schools including Waverly High School.
Ownership History
Date
Name
Owned For
Owner Type
Purchase Details
Closed on
Apr 19, 2017
Sold by
Hornung Lyle L and Hornung Mary A
Bought by
Hornung Properties Llc
Current Estimated Value
Home Financials for this Owner
Home Financials are based on the most recent Mortgage that was taken out on this home.
Original Mortgage
$125,000
Outstanding Balance
$101,255
Interest Rate
4.3%
Mortgage Type
Commercial
Estimated Equity
$292,463
Create a Home Valuation Report for This Property
The Home Valuation Report is an in-depth analysis detailing your home's value as well as a comparison with similar homes in the area
Purchase History
We collect this data history from publicly available records. To have your information removed, we recommend requesting removal directly through your county’s website.
| Date | Buyer | Sale Price | Title Company |
|---|---|---|---|
| Hornung Properties Llc | $162,000 | None Available |
Source: Public Records
Mortgage History
We collect this data history from publicly available records. To have your information removed, we recommend requesting removal directly through your county’s website.
| Date | Status | Borrower | Loan Amount |
|---|---|---|---|
| Open | Hornung Properties Llc | $125,000 |
Source: Public Records
Tax History
| Year | Tax Paid | Tax Assessment Tax Assessment Total Assessment is a certain percentage of the fair market value that is determined by local assessors to be the total taxable value of land and additions on the property. | Land | Improvement |
|---|---|---|---|---|
| 2025 | $3,142 | $353,100 | $120,000 | $233,100 |
| 2024 | $3,142 | $319,500 | $120,000 | $199,500 |
| 2023 | $4,268 | $310,200 | $120,000 | $190,200 |
| 2022 | $3,928 | $228,200 | $81,000 | $147,200 |
| 2021 | $3,683 | $228,200 | $81,000 | $147,200 |
| 2020 | $3,442 | $209,200 | $76,500 | $132,700 |
| 2019 | $3,445 | $209,200 | $76,500 | $132,700 |
| 2018 | $2,710 | $162,200 | $63,000 | $99,200 |
| 2017 | $2,687 | $162,200 | $63,000 | $99,200 |
| 2016 | $2,617 | $157,000 | $31,500 | $125,500 |
| 2015 | $2,661 | $157,000 | $31,500 | $125,500 |
| 2014 | $2,835 | $164,100 | $31,500 | $132,600 |
| 2013 | -- | $164,100 | $31,500 | $132,600 |
Source: Public Records
Map
Nearby Homes
- 3741 Oakview Blvd
- 5830 Rock Creek Rd
- 135 Hunter St
- 120 Hunter St
- 6030 Little Salt Rd
- 2118 Wilsonville Rd
- TBD-2 Bluff Rd
- 2415 County Road A
- 6531 Mill Rd
- 7015 W Agnew Rd
- TBD Ash St
- 301 Ash St
- 212 7th St
- Lot 1, Block 5 4th St
- Lot 5, Block 2 4th St
- Lot 4, Block 1 4th St
- Lot 2, Block 2 4th St
- Lot 11, Block 2 4th St
- Lot 1, Block 3 4th St
- Lot 12, Block 2 4th St
Your Personal Tour Guide
Ask me questions while you tour the home.