300 E 1st St Brookston, IN 47923
Estimated Value: $134,000 - $174,786
2
Beds
1
Bath
1,074
Sq Ft
$140/Sq Ft
Est. Value
About This Home
This home is located at 300 E 1st St, Brookston, IN 47923 and is currently estimated at $149,929, approximately $139 per square foot. 300 E 1st St is a home located in White County with nearby schools including Frontier Elementary School and Frontier Junior/Senior High School.
Ownership History
Date
Name
Owned For
Owner Type
Purchase Details
Closed on
Oct 30, 2018
Sold by
Thomas Charles R and Thomas Jan M
Bought by
Tucker Monica D
Current Estimated Value
Home Financials for this Owner
Home Financials are based on the most recent Mortgage that was taken out on this home.
Original Mortgage
$31,269
Outstanding Balance
$27,103
Interest Rate
4.6%
Mortgage Type
New Conventional
Estimated Equity
$122,826
Create a Home Valuation Report for This Property
The Home Valuation Report is an in-depth analysis detailing your home's value as well as a comparison with similar homes in the area
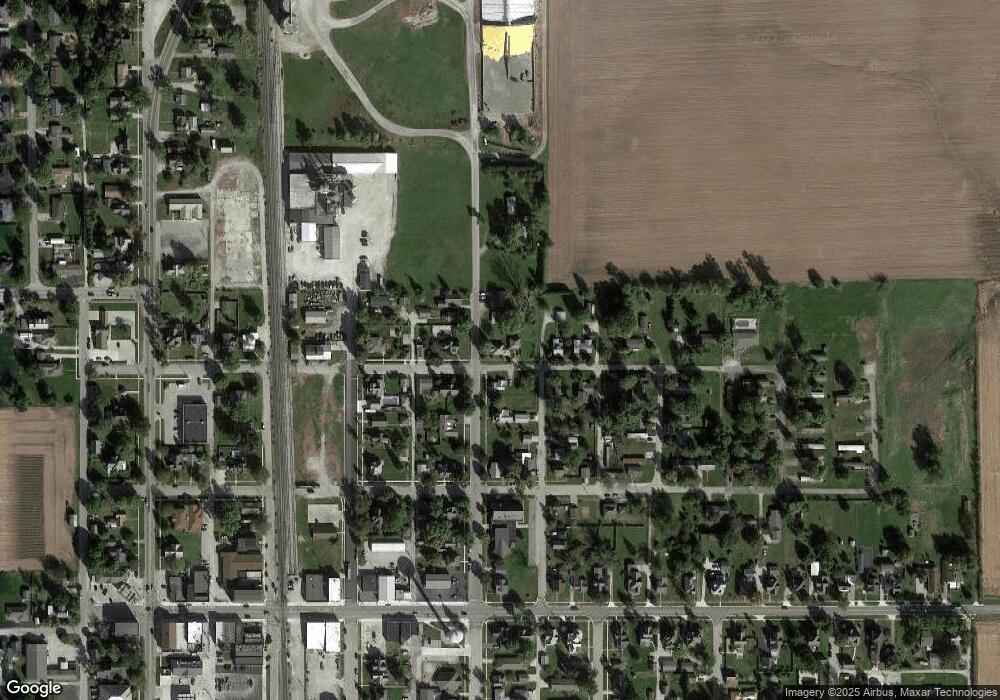
Purchase History
We collect this data history from publicly available records. To have your information removed, we recommend requesting removal directly through your county’s website.
| Date | Buyer | Sale Price | Title Company |
|---|---|---|---|
| Tucker Monica D | $39,086 | Attorney Only |
Source: Public Records
Mortgage History
We collect this data history from publicly available records. To have your information removed, we recommend requesting removal directly through your county’s website.
| Date | Status | Borrower | Loan Amount |
|---|---|---|---|
| Open | Tucker Monica D | $31,269 |
Source: Public Records
Tax History
| Year | Tax Paid | Tax Assessment Tax Assessment Total Assessment is a certain percentage of the fair market value that is determined by local assessors to be the total taxable value of land and additions on the property. | Land | Improvement |
|---|---|---|---|---|
| 2025 | $917 | $164,000 | $12,400 | $151,600 |
| 2024 | $674 | $148,200 | $12,400 | $135,800 |
| 2023 | $529 | $131,800 | $12,400 | $119,400 |
| 2022 | $548 | $118,800 | $12,400 | $106,400 |
| 2021 | $485 | $109,300 | $12,400 | $96,900 |
| 2020 | $343 | $94,300 | $12,400 | $81,900 |
| 2019 | $297 | $90,700 | $12,400 | $78,300 |
| 2018 | $208 | $87,700 | $12,400 | $75,300 |
| 2017 | $968 | $86,600 | $12,400 | $74,200 |
| 2016 | $1,407 | $80,800 | $12,400 | $68,400 |
| 2014 | $282 | $73,300 | $16,500 | $56,800 |
Source: Public Records
Map
Nearby Homes
Your Personal Tour Guide
Ask me questions while you tour the home.