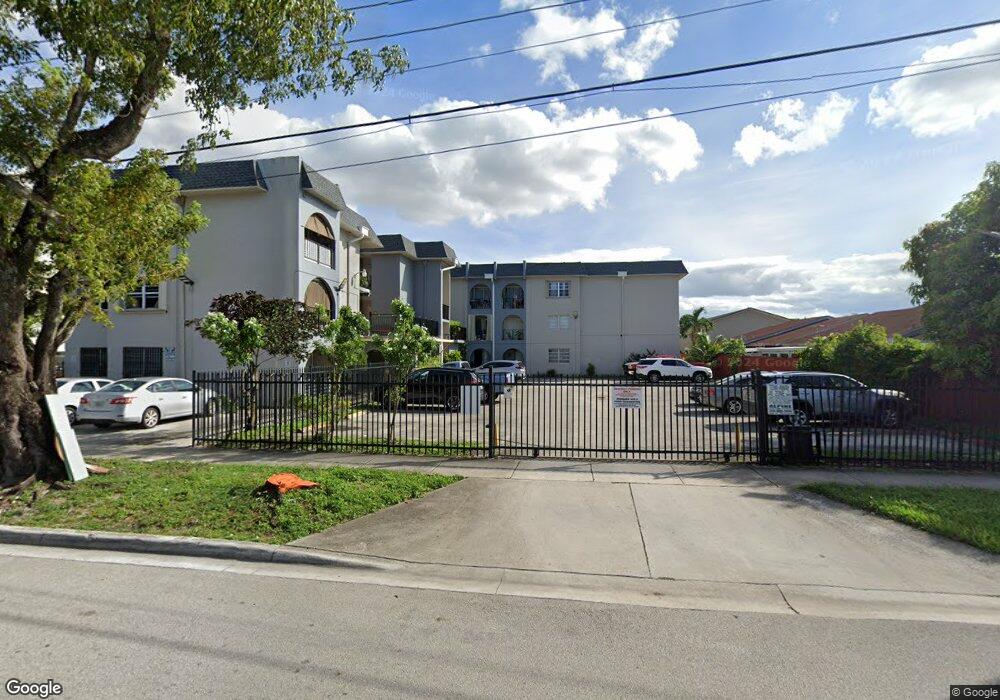
300 W 74th Place Unit 201 Hialeah, FL 33014
Amelia District NeighborhoodEstimated Value: $220,185 - $256,000
2
Beds
2
Baths
846
Sq Ft
$278/Sq Ft
Est. Value
About This Home
This home is located at 300 W 74th Place Unit 201, Hialeah, FL 33014 and is currently estimated at $235,546, approximately $278 per square foot. 300 W 74th Place Unit 201 is a home located in Miami-Dade County with nearby schools including Palm Springs Elementary School, Hialeah Middle School, and Hialeah Senior High School.
Ownership History
Date
Name
Owned For
Owner Type
Purchase Details
Closed on
Aug 18, 2015
Sold by
Saiden Zenaida and Aragon Sully A
Bought by
Saiden Zenaida and Aragon Sully A
Current Estimated Value
Purchase Details
Closed on
Apr 9, 2009
Sold by
Saiden Zenaida and Aragon Sully A
Bought by
Saiden Zenaida and Aragon Sully A
Purchase Details
Closed on
Jun 14, 1999
Sold by
Camejo Yamil Musa Irene
Bought by
Saiden Zenaida and Aragon Sully A
Home Financials for this Owner
Home Financials are based on the most recent Mortgage that was taken out on this home.
Original Mortgage
$46,800
Interest Rate
6.94%
Mortgage Type
New Conventional
Purchase Details
Closed on
Oct 13, 1993
Sold by
Acosta Marcelo E and Acosta Marta L
Bought by
Musa Yamil and Camejo Irene
Home Financials for this Owner
Home Financials are based on the most recent Mortgage that was taken out on this home.
Original Mortgage
$24,500
Interest Rate
7.07%
Create a Home Valuation Report for This Property
The Home Valuation Report is an in-depth analysis detailing your home's value as well as a comparison with similar homes in the area
Home Values in the Area
Average Home Value in this Area
Purchase History
| Date | Buyer | Sale Price | Title Company |
|---|---|---|---|
| Saiden Zenaida | -- | Attorney | |
| Saiden Zenaida | -- | Attorney | |
| Saiden Zenaida | $52,000 | -- | |
| Musa Yamil | $35,000 | -- |
Source: Public Records
Mortgage History
| Date | Status | Borrower | Loan Amount |
|---|---|---|---|
| Open | Saiden Zenaida | $49,700 | |
| Closed | Saiden Zenaida | $46,800 | |
| Previous Owner | Musa Yamil | $24,500 |
Source: Public Records
Tax History
| Year | Tax Paid | Tax Assessment Tax Assessment Total Assessment is a certain percentage of the fair market value that is determined by local assessors to be the total taxable value of land and additions on the property. | Land | Improvement |
|---|---|---|---|---|
| 2025 | $511 | $58,381 | -- | -- |
| 2024 | $503 | $56,736 | -- | -- |
| 2023 | $503 | $55,084 | $0 | $0 |
| 2022 | $492 | $53,480 | $0 | $0 |
| 2021 | $495 | $51,923 | $0 | $0 |
| 2020 | $492 | $51,207 | $0 | $0 |
| 2019 | $485 | $50,056 | $0 | $0 |
| 2018 | $457 | $49,123 | $0 | $0 |
| 2017 | $443 | $48,113 | $0 | $0 |
| 2016 | $433 | $47,124 | $0 | $0 |
| 2015 | $434 | $46,797 | $0 | $0 |
| 2014 | $435 | $46,426 | $0 | $0 |
Source: Public Records
Map
Nearby Homes
- 7215 W 3rd Ave
- 7205 W 2nd Ln
- 7184 W 2nd Ct
- 7144 W 2nd Ln
- 7568 W 4th Ct
- 6780 W 2nd Ct Unit 304
- 6780 W 2nd Ct Unit 408
- 525 W 69th St Unit 207
- 7605 W 6th Ave
- 575 W 69th St Unit 208
- 6675 W 4th Ave Unit 203
- 6620 W 2nd Ct Unit 407
- 6600 W 2nd Ct Unit 24
- 655 W 70th Place
- 6570 W 2nd Ct Unit 19C
- 6575 W 4th Ave Unit 507B
- 695 W 73rd Place
- 685 W 77th St
- 8001 W 6th Ave Unit M
- 8005 W 6th Ave Unit B
- 300 W 74th Place Unit 211
- 300 W 74th Place Unit 115
- 300 W 74th Place Unit 304
- 300 W 74th Place Unit 306
- 300 W 74th Place Unit 204
- 300 W 74th Place Unit 209
- 300 W 74th Place Unit 303
- 300 W 74th Place Unit 208
- 300 W 74th Place Unit 106
- 300 W 74th Place Unit 210
- 300 W 74th Place Unit 108
- 300 W 74th Place Unit 102
- 300 W 74th Place Unit 217
- 300 W 74th Place Unit 109
- 300 W 74th Place Unit 316
- 300 W 74th Place Unit 112
- 300 W 74th Place Unit 202
- 300 W 74th Place Unit 101
- 300 W 74th Place Unit 113
- 300 W 74th Place Unit 313
Your Personal Tour Guide
Ask me questions while you tour the home.