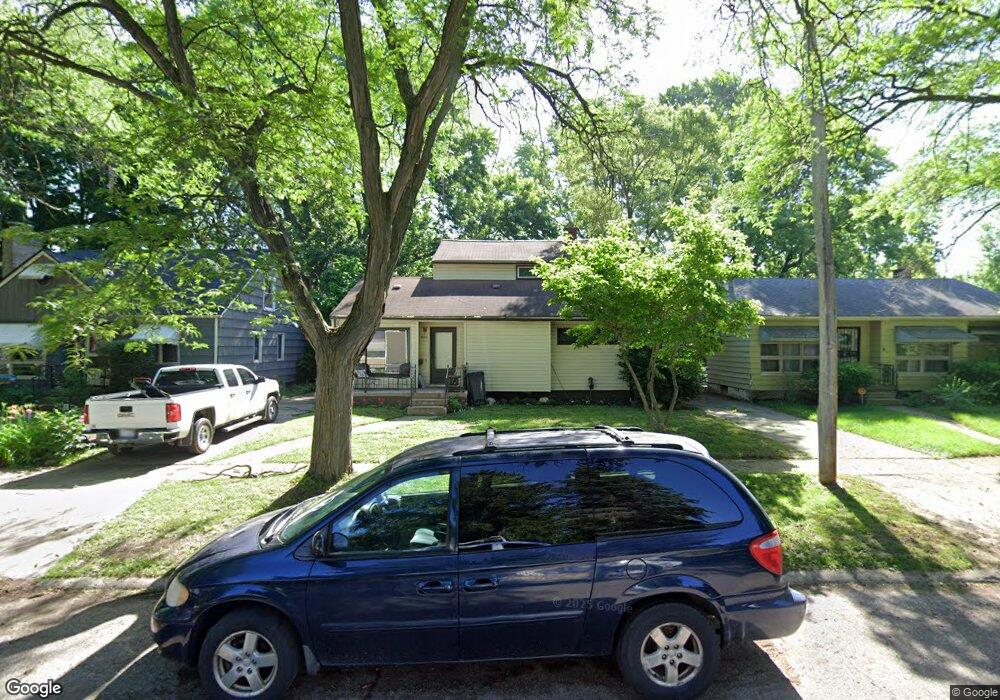
3007 Dearborn Ave Flint, MI 48507
Circle Neighborhood NeighborhoodEstimated Value: $133,323 - $191,000
5
Beds
2
Baths
2,054
Sq Ft
$78/Sq Ft
Est. Value
About This Home
This home is located at 3007 Dearborn Ave, Flint, MI 48507 and is currently estimated at $160,581, approximately $78 per square foot. 3007 Dearborn Ave is a home located in Genesee County with nearby schools including Freeman Elementary School, Flint Southwestern Classical Academy, and International Academy of Flint (K-12).
Ownership History
Date
Name
Owned For
Owner Type
Purchase Details
Closed on
Aug 9, 2018
Sold by
Aja Investments Llc
Bought by
Bigil Natasha
Current Estimated Value
Purchase Details
Closed on
Jun 14, 2017
Sold by
Habour Portfolio Vii Lp
Bought by
Aja Investments Llc
Purchase Details
Closed on
May 9, 2013
Sold by
Harbour Portfolio Vii Lp
Bought by
Vigil Natasha
Home Financials for this Owner
Home Financials are based on the most recent Mortgage that was taken out on this home.
Original Mortgage
$44,040
Interest Rate
10%
Mortgage Type
Seller Take Back
Purchase Details
Closed on
Feb 22, 2013
Sold by
Federal National Mortgage Association
Bought by
Harbour Portfolio Vii Lp
Purchase Details
Closed on
May 26, 2010
Sold by
Gutter Mccoy and Gutter Ora P
Bought by
Federal National Mortgage Association
Create a Home Valuation Report for This Property
The Home Valuation Report is an in-depth analysis detailing your home's value as well as a comparison with similar homes in the area
Home Values in the Area
Average Home Value in this Area
Purchase History
| Date | Buyer | Sale Price | Title Company |
|---|---|---|---|
| Bigil Natasha | $35,000 | None Available | |
| Aja Investments Llc | $14,000 | None Available | |
| Vigil Natasha | -- | None Available | |
| Vigil Natasha | $45,500 | None Available | |
| Harbour Portfolio Vii Lp | $11,137 | Servicelink | |
| Federal National Mortgage Association | $143,844 | None Available |
Source: Public Records
Mortgage History
| Date | Status | Borrower | Loan Amount |
|---|---|---|---|
| Previous Owner | Vigil Natasha | $44,040 |
Source: Public Records
Tax History
| Year | Tax Paid | Tax Assessment Tax Assessment Total Assessment is a certain percentage of the fair market value that is determined by local assessors to be the total taxable value of land and additions on the property. | Land | Improvement |
|---|---|---|---|---|
| 2025 | $2,087 | $65,600 | $0 | $0 |
| 2024 | $1,912 | $57,900 | $0 | $0 |
| 2023 | $1,852 | $44,700 | $0 | $0 |
| 2022 | $0 | $39,000 | $0 | $0 |
| 2021 | $1,888 | $37,000 | $0 | $0 |
| 2020 | $1,313 | $28,200 | $0 | $0 |
| 2019 | $1,082 | $20,300 | $0 | $0 |
| 2018 | $2,201 | $22,800 | $0 | $0 |
| 2017 | $1,855 | $0 | $0 | $0 |
| 2016 | $1,548 | $0 | $0 | $0 |
| 2015 | -- | $0 | $0 | $0 |
| 2014 | -- | $0 | $0 | $0 |
| 2012 | -- | $26,000 | $0 | $0 |
Source: Public Records
Map
Nearby Homes
- 2910 Shawnee Ave
- 3110 Menominee Ave
- 3505 Comanche Ave
- 3009 Menominee Ave
- 720 Algonquin Ave
- 3617 Circle Dr
- 630 Buckingham Ave
- 621 Burroughs Ave
- 3222 Chambers St
- 2221 Howard Ave
- 366 E Atherton Rd
- 3056 Shaw St
- 420 Burroughs Ave
- 4126 Circle Dr
- 3218 Collingwood Pkwy
- 352 Buckingham Ave
- 2224 Crocker Ave
- 4127 Custer Ave
- 326 Burroughs Ave
- 213 E Lakeview Ave
- 3001 Dearborn Ave
- 3013 Dearborn Ave
- 2919 Dearborn Ave
- 3019 Dearborn Ave
- 3002 Comanche Ave
- 3008 Comanche Ave
- 2913 Dearborn Ave
- 3014 Comanche Ave
- 2914 Comanche Ave
- 2908 Comanche Ave
- 3020 Comanche Ave
- 3018 Dearborn Ave
- 2907 Dearborn Ave
- 2902 Comanche Ave
- 2907 Dearborn St
- 3101 Dearborn Ave
- 3002 Dearborn Ave
- 3025 Dearborn Ave
- 3018 Dearborn St
- 2914 Dearborn Ave
Your Personal Tour Guide
Ask me questions while you tour the home.