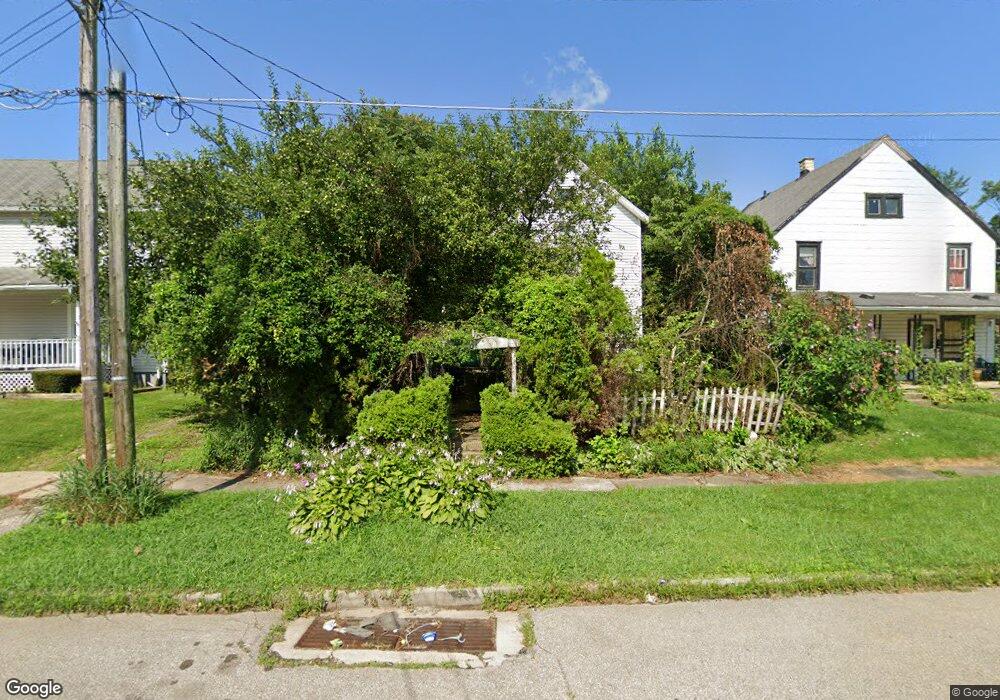
301 2nd Ave Mansfield, OH 44902
Estimated Value: $69,989 - $94,000
2
Beds
1
Bath
1,269
Sq Ft
$63/Sq Ft
Est. Value
About This Home
This home is located at 301 2nd Ave, Mansfield, OH 44902 and is currently estimated at $80,497, approximately $63 per square foot. 301 2nd Ave is a home located in Richland County with nearby schools including Goal Digital Academy, St. Peter's Elementary/Montessori School, and Temple-Christian School.
Ownership History
Date
Name
Owned For
Owner Type
Purchase Details
Closed on
Aug 31, 1998
Sold by
Trst James Copeland
Bought by
Rice Robert E
Current Estimated Value
Home Financials for this Owner
Home Financials are based on the most recent Mortgage that was taken out on this home.
Original Mortgage
$24,375
Interest Rate
7.03%
Mortgage Type
New Conventional
Purchase Details
Closed on
Apr 28, 1998
Sold by
Utterback Steven J
Bought by
Copeland James C
Create a Home Valuation Report for This Property
The Home Valuation Report is an in-depth analysis detailing your home's value as well as a comparison with similar homes in the area
Home Values in the Area
Average Home Value in this Area
Purchase History
| Date | Buyer | Sale Price | Title Company |
|---|---|---|---|
| Rice Robert E | $21,000 | -- | |
| Copeland James C | $12,000 | -- |
Source: Public Records
Mortgage History
| Date | Status | Borrower | Loan Amount |
|---|---|---|---|
| Closed | Rice Robert E | $24,375 |
Source: Public Records
Tax History
| Year | Tax Paid | Tax Assessment Tax Assessment Total Assessment is a certain percentage of the fair market value that is determined by local assessors to be the total taxable value of land and additions on the property. | Land | Improvement |
|---|---|---|---|---|
| 2025 | $564 | $11,780 | $1,650 | $10,130 |
| 2024 | $564 | $11,780 | $1,650 | $10,130 |
| 2023 | $564 | $11,780 | $1,650 | $10,130 |
| 2022 | $572 | $10,010 | $1,670 | $8,340 |
| 2021 | $576 | $10,010 | $1,670 | $8,340 |
| 2020 | $589 | $10,010 | $1,670 | $8,340 |
| 2019 | $653 | $10,010 | $1,670 | $8,340 |
| 2018 | $644 | $10,010 | $1,670 | $8,340 |
| 2017 | $652 | $10,010 | $1,670 | $8,340 |
| 2016 | $677 | $10,490 | $2,220 | $8,270 |
| 2015 | $647 | $10,490 | $2,220 | $8,270 |
| 2014 | $639 | $10,490 | $2,220 | $8,270 |
| 2012 | $245 | $10,490 | $2,290 | $8,200 |
Source: Public Records
Map
Nearby Homes
- 382 Orange St
- 346 Newman St
- 369 7th Ave
- 90 Oak St
- 489 Boals Ave
- 0 North St Unit 9072753
- 0 Lot #23128 Unit 9069815
- 146 E 1st St
- 396 Charvid Ave
- 352 Remy Ave
- 266 Illinois Ave N
- 167 S Adams St
- 195 Hedges St
- 62 Bahl Ave
- 580 N Mulberry St
- 118 Raymond Ave
- 524 Lida St
- 223 Hedges St
- 822 Park Ave E
- 832 Park Ave E
Your Personal Tour Guide
Ask me questions while you tour the home.