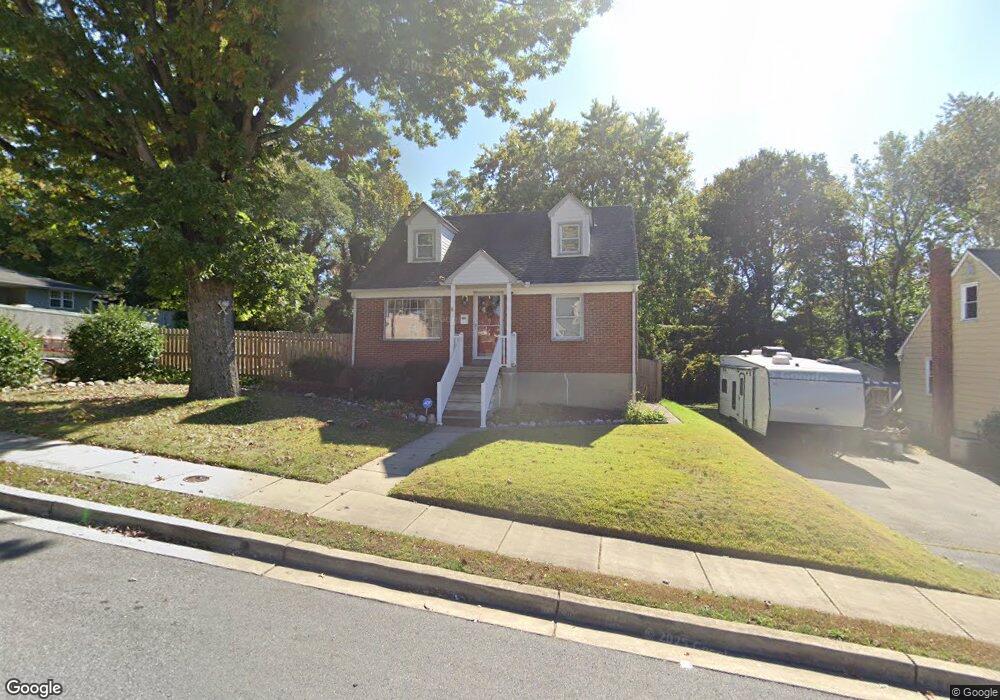
301 6th Ave Brooklyn, MD 21225
Estimated Value: $261,065 - $292,000
Studio
1
Bath
1,170
Sq Ft
$243/Sq Ft
Est. Value
About This Home
This home is located at 301 6th Ave, Brooklyn, MD 21225 and is currently estimated at $283,766, approximately $242 per square foot. 301 6th Ave is a home located in Anne Arundel County with nearby schools including Belle Grove Elementary School, Brooklyn Park Middle School, and North County High School.
Ownership History
Date
Name
Owned For
Owner Type
Purchase Details
Closed on
Dec 20, 2016
Sold by
Fador Vicki and Malone Ellen
Bought by
Fador Allison
Current Estimated Value
Home Financials for this Owner
Home Financials are based on the most recent Mortgage that was taken out on this home.
Original Mortgage
$135,000
Outstanding Balance
$110,400
Interest Rate
3.94%
Mortgage Type
New Conventional
Estimated Equity
$173,366
Purchase Details
Closed on
May 30, 2012
Sold by
Cole Alice G and Cole Alice Garnett
Bought by
Cole Alice G and Fador Vicki
Create a Home Valuation Report for This Property
The Home Valuation Report is an in-depth analysis detailing your home's value as well as a comparison with similar homes in the area
Home Values in the Area
Average Home Value in this Area
Purchase History
| Date | Buyer | Sale Price | Title Company |
|---|---|---|---|
| Fador Allison | $150,000 | Perfection Title Ltd | |
| Cole Alice G | -- | None Available |
Source: Public Records
Mortgage History
| Date | Status | Borrower | Loan Amount |
|---|---|---|---|
| Open | Fador Allison | $135,000 |
Source: Public Records
Tax History
| Year | Tax Paid | Tax Assessment Tax Assessment Total Assessment is a certain percentage of the fair market value that is determined by local assessors to be the total taxable value of land and additions on the property. | Land | Improvement |
|---|---|---|---|---|
| 2025 | $2,551 | $219,900 | $108,300 | $111,600 |
| 2024 | $2,551 | $209,267 | $0 | $0 |
| 2023 | $2,470 | $198,633 | $0 | $0 |
| 2022 | $2,296 | $188,000 | $94,700 | $93,300 |
| 2020 | $2,175 | $174,133 | $0 | $0 |
| 2019 | $2,138 | $167,200 | $94,700 | $72,500 |
| 2018 | $1,678 | $165,500 | $0 | $0 |
| 2017 | $2,052 | $163,800 | $0 | $0 |
| 2016 | -- | $162,100 | $0 | $0 |
| 2015 | -- | $162,100 | $0 | $0 |
| 2014 | -- | $162,100 | $0 | $0 |
Source: Public Records
Map
Nearby Homes
Your Personal Tour Guide
Ask me questions while you tour the home.