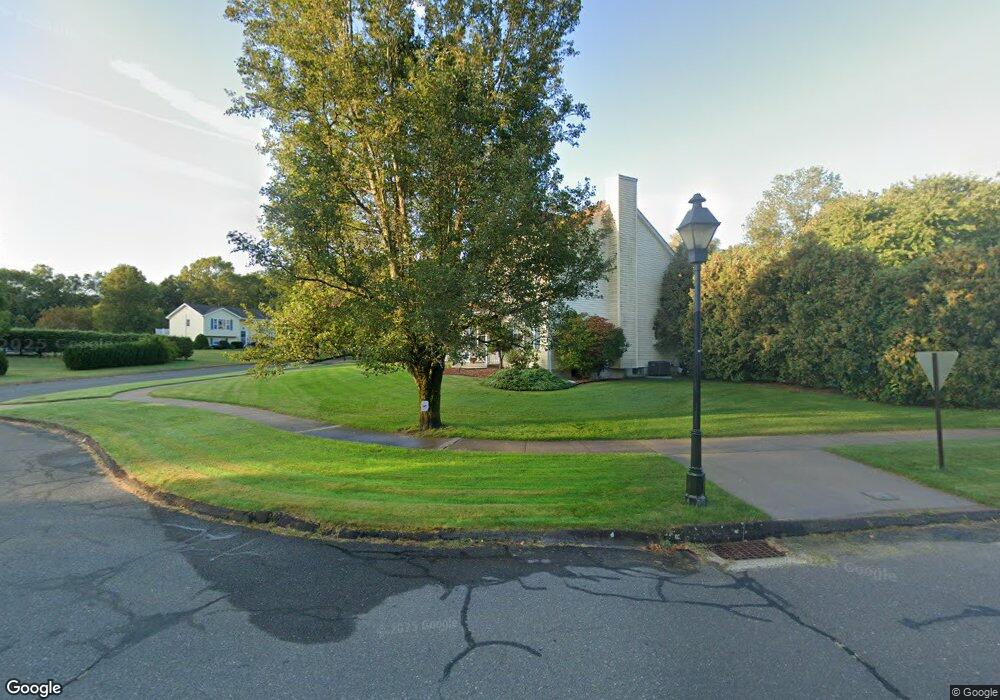
301 Beechwood Windsor, CT 06095
West Windsor NeighborhoodEstimated Value: $471,997 - $527,000
3
Beds
3
Baths
2,009
Sq Ft
$245/Sq Ft
Est. Value
About This Home
This home is located at 301 Beechwood, Windsor, CT 06095 and is currently estimated at $491,749, approximately $244 per square foot. 301 Beechwood is a home located in Hartford County with nearby schools including Poquonock Elementary School, Clover Street School, and Sage Park Middle School.
Ownership History
Date
Name
Owned For
Owner Type
Purchase Details
Closed on
Nov 22, 2017
Sold by
Thurston Properties Ll
Bought by
Thurston Todd
Current Estimated Value
Purchase Details
Closed on
Apr 18, 2016
Sold by
Thurston Todd L
Bought by
Thurston Properties Ll
Purchase Details
Closed on
Mar 18, 2004
Sold by
Hale Joy
Bought by
Thurston Todd
Purchase Details
Closed on
Dec 22, 1999
Sold by
Northowood Homes Llc
Bought by
Hale Joy and Freeman Amy
Create a Home Valuation Report for This Property
The Home Valuation Report is an in-depth analysis detailing your home's value as well as a comparison with similar homes in the area
Home Values in the Area
Average Home Value in this Area
Purchase History
| Date | Buyer | Sale Price | Title Company |
|---|---|---|---|
| Thurston Todd | -- | -- | |
| Thurston Properties Ll | -- | -- | |
| Thurston Todd | $289,250 | -- | |
| Hale Joy | $225,200 | -- |
Source: Public Records
Mortgage History
| Date | Status | Borrower | Loan Amount |
|---|---|---|---|
| Open | Hale Joy | $43,000 | |
| Previous Owner | Hale Joy | $218,000 | |
| Previous Owner | Hale Joy | $230,000 |
Source: Public Records
Tax History
| Year | Tax Paid | Tax Assessment Tax Assessment Total Assessment is a certain percentage of the fair market value that is determined by local assessors to be the total taxable value of land and additions on the property. | Land | Improvement |
|---|---|---|---|---|
| 2025 | $7,839 | $275,520 | $66,570 | $208,950 |
| 2024 | $8,354 | $275,520 | $66,570 | $208,950 |
| 2023 | $6,362 | $189,350 | $52,850 | $136,500 |
| 2022 | $6,300 | $189,350 | $52,850 | $136,500 |
| 2021 | $6,300 | $189,350 | $52,850 | $136,500 |
| 2020 | $6,269 | $189,350 | $52,850 | $136,500 |
| 2019 | $6,131 | $189,350 | $52,850 | $136,500 |
| 2018 | $6,049 | $183,540 | $52,850 | $130,690 |
| 2017 | $5,956 | $183,540 | $52,850 | $130,690 |
| 2016 | $5,785 | $183,540 | $52,850 | $130,690 |
| 2015 | $5,675 | $183,540 | $52,850 | $130,690 |
| 2014 | $5,592 | $183,540 | $52,850 | $130,690 |
Source: Public Records
Map
Nearby Homes
- 999 Stone Rd
- 39 Loren Cir
- 823 Stone Rd
- 857 Stone Rd
- 49 Seymour Rd
- 0 Walnut Dr
- 0 Walnut and Larch Dr
- 212 Ethan Dr
- 3 Bonnieview Dr
- 19 Chelsea Ln Unit 19
- 10 Eastfield Farms Dr
- 26 Melody Ln
- 36 Larch Dr
- 3-1 S Main St
- 96 Fieldstone Dr
- 25 Nutmeg Rd
- 1 Morello Cir
- 31 Woodduck Farms Rd
- 10 Cleary Ln
- 39 Woodduck Farms Rd
Your Personal Tour Guide
Ask me questions while you tour the home.