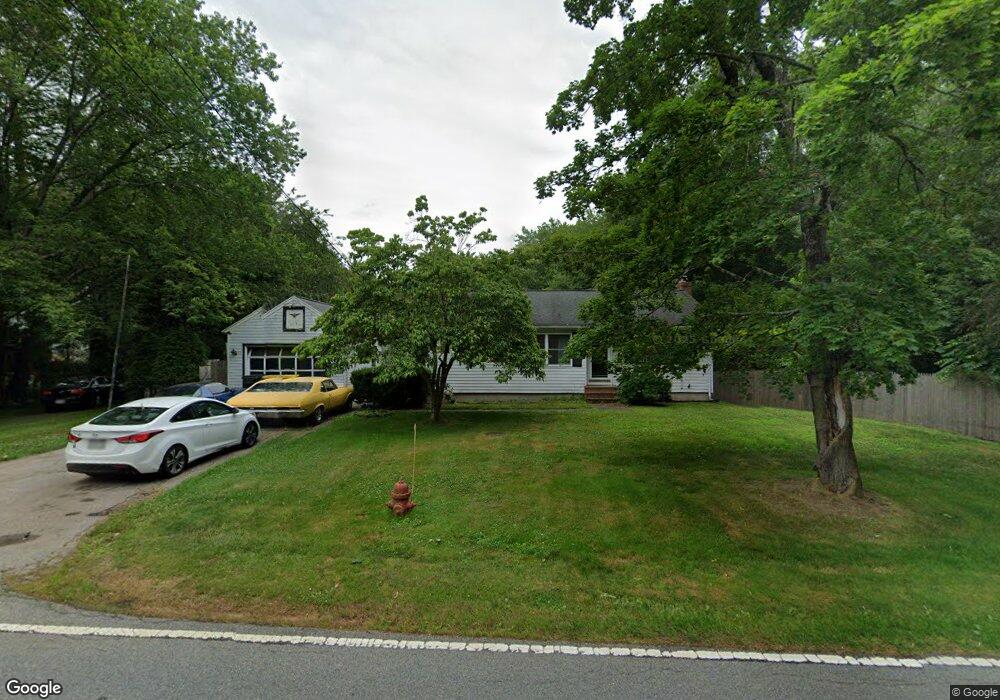
301 Bridge St Bridgewater, MA 02324
Estimated Value: $480,000 - $573,000
2
Beds
1
Bath
1,140
Sq Ft
$456/Sq Ft
Est. Value
About This Home
This home is located at 301 Bridge St, Bridgewater, MA 02324 and is currently estimated at $519,572, approximately $455 per square foot. 301 Bridge St is a home located in Plymouth County with nearby schools including Mitchell Elementary School, Williams Intermediate School, and Bridgewater Middle School.
Ownership History
Date
Name
Owned For
Owner Type
Purchase Details
Closed on
Jul 14, 1995
Sold by
Fhlmc
Bought by
Vernon Paul W and Vernon Patricia A
Current Estimated Value
Purchase Details
Closed on
Nov 28, 1994
Sold by
Corey Mark S and Corey Joanne
Bought by
Fhlmc
Purchase Details
Closed on
Jan 29, 1988
Sold by
Steel Berl D
Bought by
Corey Mark S
Create a Home Valuation Report for This Property
The Home Valuation Report is an in-depth analysis detailing your home's value as well as a comparison with similar homes in the area
Home Values in the Area
Average Home Value in this Area
Purchase History
| Date | Buyer | Sale Price | Title Company |
|---|---|---|---|
| Vernon Paul W | $101,000 | -- | |
| Fhlmc | $124,573 | -- | |
| Corey Mark S | $162,000 | -- |
Source: Public Records
Mortgage History
| Date | Status | Borrower | Loan Amount |
|---|---|---|---|
| Open | Corey Mark S | $213,200 | |
| Closed | Corey Mark S | $224,000 |
Source: Public Records
Tax History
| Year | Tax Paid | Tax Assessment Tax Assessment Total Assessment is a certain percentage of the fair market value that is determined by local assessors to be the total taxable value of land and additions on the property. | Land | Improvement |
|---|---|---|---|---|
| 2025 | $5,685 | $480,600 | $208,500 | $272,100 |
| 2024 | $5,616 | $462,600 | $198,500 | $264,100 |
| 2023 | $5,562 | $433,200 | $185,500 | $247,700 |
| 2022 | $5,453 | $380,800 | $162,800 | $218,000 |
| 2021 | $4,943 | $341,400 | $145,300 | $196,100 |
| 2020 | $4,880 | $331,300 | $139,700 | $191,600 |
| 2019 | $4,790 | $323,000 | $139,700 | $183,300 |
| 2018 | $14,998 | $291,100 | $129,200 | $161,900 |
| 2017 | $4,285 | $274,500 | $129,200 | $145,300 |
| 2016 | $4,117 | $264,900 | $126,800 | $138,100 |
| 2015 | $4,123 | $253,900 | $123,000 | $130,900 |
| 2014 | $3,911 | $240,700 | $113,400 | $127,300 |
Source: Public Records
Map
Nearby Homes
- Lot 1 Mill St
- 41 High Pond Dr
- 17 Briarwood Cir
- 89 Trailwood Dr
- 1617 Plymouth St Unit 3
- 1617 Plymouth St
- 42 Crystal Water Dr
- 30 Cesidio Ct
- 580 Broad St Unit 2
- 580 Broad St Unit 1
- 281 Central St
- 100 Chestnut St
- 5 Lynn Lee Terrace
- 30 Sanger St
- 36 Magnolia Way
- 47 Hale St
- 84 Hammond St
- 57 Stetson St
- 11 Bramblewood St
- 127 Leaf Ln
Your Personal Tour Guide
Ask me questions while you tour the home.