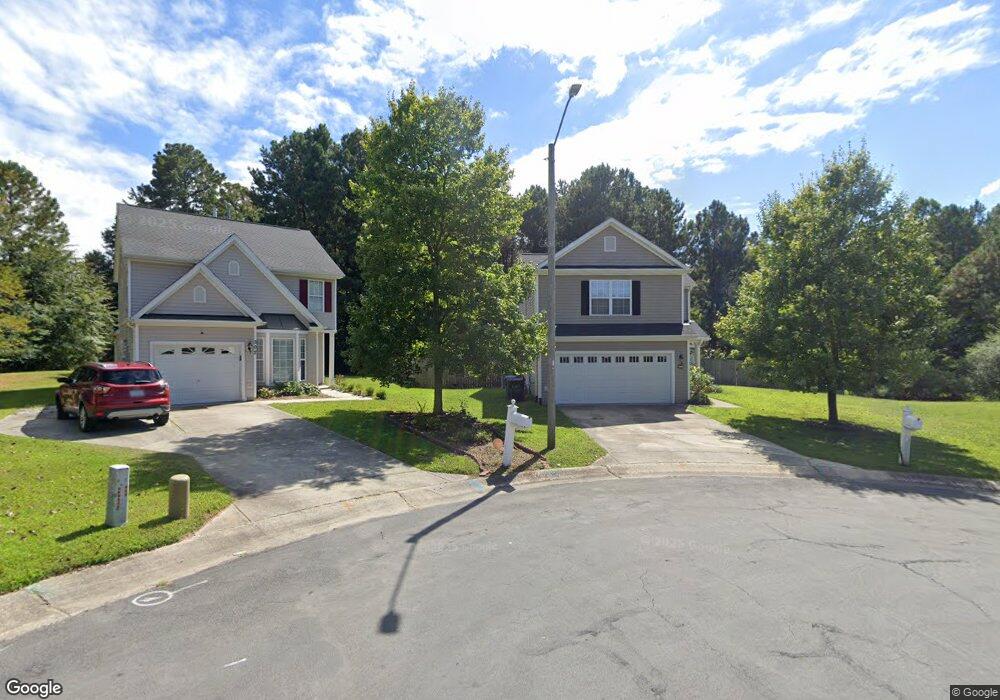
301 Burrell Rd Durham, NC 27703
Eastern Durham NeighborhoodEstimated Value: $341,000 - $374,000
3
Beds
3
Baths
1,656
Sq Ft
$217/Sq Ft
Est. Value
About This Home
This home is located at 301 Burrell Rd, Durham, NC 27703 and is currently estimated at $359,806, approximately $217 per square foot. 301 Burrell Rd is a home located in Durham County with nearby schools including Glenn Elementary, John W Neal Middle School, and Southern School of Energy & Sustainability.
Ownership History
Date
Name
Owned For
Owner Type
Purchase Details
Closed on
May 31, 2019
Sold by
Latting John Wesley and Latting Michelle Elizabeth Wilson
Bought by
Shah Dhaval R
Current Estimated Value
Home Financials for this Owner
Home Financials are based on the most recent Mortgage that was taken out on this home.
Original Mortgage
$215,000
Outstanding Balance
$189,038
Interest Rate
4.1%
Mortgage Type
New Conventional
Estimated Equity
$170,768
Purchase Details
Closed on
Dec 10, 2015
Sold by
Mayfield Vicki P and Mayfield Frederick L
Bought by
Latting John Wesley and Wilson Michelle Elizabeth
Home Financials for this Owner
Home Financials are based on the most recent Mortgage that was taken out on this home.
Original Mortgage
$159,500
Interest Rate
2.5%
Mortgage Type
Adjustable Rate Mortgage/ARM
Purchase Details
Closed on
Feb 28, 2002
Sold by
Westfield Homes Of North Carolina Inc
Bought by
Mayfield Frederick L and Mayfield Vicki P
Home Financials for this Owner
Home Financials are based on the most recent Mortgage that was taken out on this home.
Original Mortgage
$139,815
Interest Rate
6.81%
Mortgage Type
FHA
Create a Home Valuation Report for This Property
The Home Valuation Report is an in-depth analysis detailing your home's value as well as a comparison with similar homes in the area
Home Values in the Area
Average Home Value in this Area
Purchase History
| Date | Buyer | Sale Price | Title Company |
|---|---|---|---|
| Shah Dhaval R | $230,000 | None Available | |
| Latting John Wesley | $159,500 | Attorney | |
| Mayfield Frederick L | $141,000 | -- |
Source: Public Records
Mortgage History
| Date | Status | Borrower | Loan Amount |
|---|---|---|---|
| Open | Shah Dhaval R | $215,000 | |
| Previous Owner | Latting John Wesley | $159,500 | |
| Previous Owner | Mayfield Frederick L | $139,815 |
Source: Public Records
Tax History
| Year | Tax Paid | Tax Assessment Tax Assessment Total Assessment is a certain percentage of the fair market value that is determined by local assessors to be the total taxable value of land and additions on the property. | Land | Improvement |
|---|---|---|---|---|
| 2025 | $3,783 | $381,633 | $94,250 | $287,383 |
| 2024 | $2,620 | $187,806 | $32,375 | $155,431 |
| 2023 | $2,460 | $187,806 | $32,375 | $155,431 |
| 2022 | $2,404 | $187,806 | $32,375 | $155,431 |
| 2021 | $2,392 | $187,806 | $32,375 | $155,431 |
| 2020 | $2,336 | $187,806 | $32,375 | $155,431 |
| 2019 | $2,336 | $187,806 | $32,375 | $155,431 |
| 2018 | $2,257 | $166,354 | $25,900 | $140,454 |
| 2017 | $2,240 | $166,354 | $25,900 | $140,454 |
| 2016 | $2,021 | $155,306 | $25,900 | $129,406 |
| 2015 | $2,251 | $162,629 | $31,088 | $131,541 |
| 2014 | $2,251 | $162,629 | $31,088 | $131,541 |
Source: Public Records
Map
Nearby Homes
- 502 Quartz Dr
- 521 Quartz Dr
- 507 Lodestone Dr
- 3708 Thornwood Dr
- 608 Chalcedony Ct
- 3511 Thornwood Dr
- 913 Valmet Dr
- 1005 Sweet Cream Ct
- 1025 Sweet Cream Ct
- 3900 Mary Martin Rd
- 3822 Mary Martin Rd
- 912 Obsidian Way
- 3804 Valleydale Dr
- 5409 Hadrian Dr
- 914 Flanders Dr
- 1113 Homecoming Way
- 4505 Tyne Dr
- 709 Grandview Dr
- 1113 Kindness Ln
- 1050 Gentle Reed Dr
- 302 Burrell Rd
- 303 Burrell Rd
- 304 Burrell Rd
- 305 Burrell Rd
- 306 Burrell Rd
- 527 N Mineral Springs Rd
- 523 N Mineral Springs Rd
- 307 Burrell Rd
- 308 Burrell Rd
- 529 N Mineral Springs Rd
- 517 N Mineral Springs Rd
- 309 Burrell Rd
- 310 Burrell Rd
- 515 N Mineral Springs Rd
- 603 N Mineral Springs Rd
- 311 Burrell Rd
- 312 Burrell Rd
- 607 N Mineral Springs Rd
- 522 N Mineral Springs Rd
- 526 N Mineral Springs Rd
Your Personal Tour Guide
Ask me questions while you tour the home.