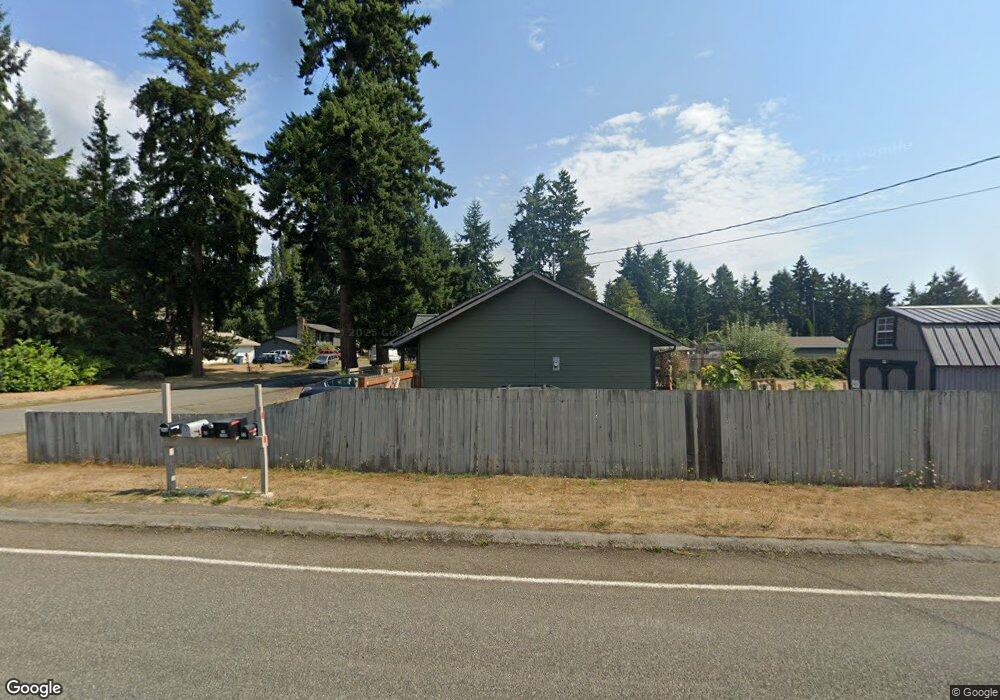
301 Cedar Ave Port Hadlock, WA 98339
Port Hadlock-Irondale NeighborhoodEstimated Value: $424,000 - $499,000
3
Beds
2
Baths
1,403
Sq Ft
$329/Sq Ft
Est. Value
About This Home
This home is located at 301 Cedar Ave, Port Hadlock, WA 98339 and is currently estimated at $461,179, approximately $328 per square foot. 301 Cedar Ave is a home located in Jefferson County with nearby schools including Chimacum Creek Primary School, Chimacum School Pi Program, and Chimacum Elementary School.
Create a Home Valuation Report for This Property
The Home Valuation Report is an in-depth analysis detailing your home's value as well as a comparison with similar homes in the area
Home Values in the Area
Average Home Value in this Area
Tax History
| Year | Tax Paid | Tax Assessment Tax Assessment Total Assessment is a certain percentage of the fair market value that is determined by local assessors to be the total taxable value of land and additions on the property. | Land | Improvement |
|---|---|---|---|---|
| 2025 | $2,740 | $351,195 | $93,500 | $257,695 |
| 2024 | $2,539 | $335,741 | $89,250 | $246,491 |
| 2023 | $2,159 | $315,287 | $80,000 | $235,287 |
| 2022 | $2,290 | $280,428 | $75,000 | $205,428 |
| 2021 | $2,259 | $252,611 | $62,400 | $190,211 |
| 2020 | $2,080 | $234,225 | $57,600 | $176,625 |
| 2019 | $1,888 | $209,045 | $52,800 | $156,245 |
| 2018 | $2,067 | $190,658 | $48,000 | $142,658 |
| 2017 | $1,724 | $183,865 | $48,000 | $135,865 |
| 2016 | $1,716 | $162,984 | $44,000 | $118,984 |
| 2015 | $1,690 | $162,984 | $44,000 | $118,984 |
| 2014 | -- | $162,984 | $44,000 | $118,984 |
| 2013 | -- | $148,165 | $40,000 | $108,165 |
Source: Public Records
Map
Nearby Homes
- 31 2nd St
- 130 Fir Cir
- 611 Cedar Ave Unit 33
- 72 Meg's Way
- 101 D St
- 1210 Irondale Rd
- 31 Petes Spur
- 90 Kem St
- 712 Ness Corner Rd
- 716 Ness Corner Rd
- 0 901024068 Unit NWM2387187
- 0 E Eugene St
- 101 Chimacum Creek Dr
- 47 Sunset Meadows Ln
- 302 S 7th Ave
- 116 Sunset Meadows Ln
- 251 Arden St
- 38 Brighton Ave
- 331 7th Ave
- 0 Lylus Ln
Your Personal Tour Guide
Ask me questions while you tour the home.