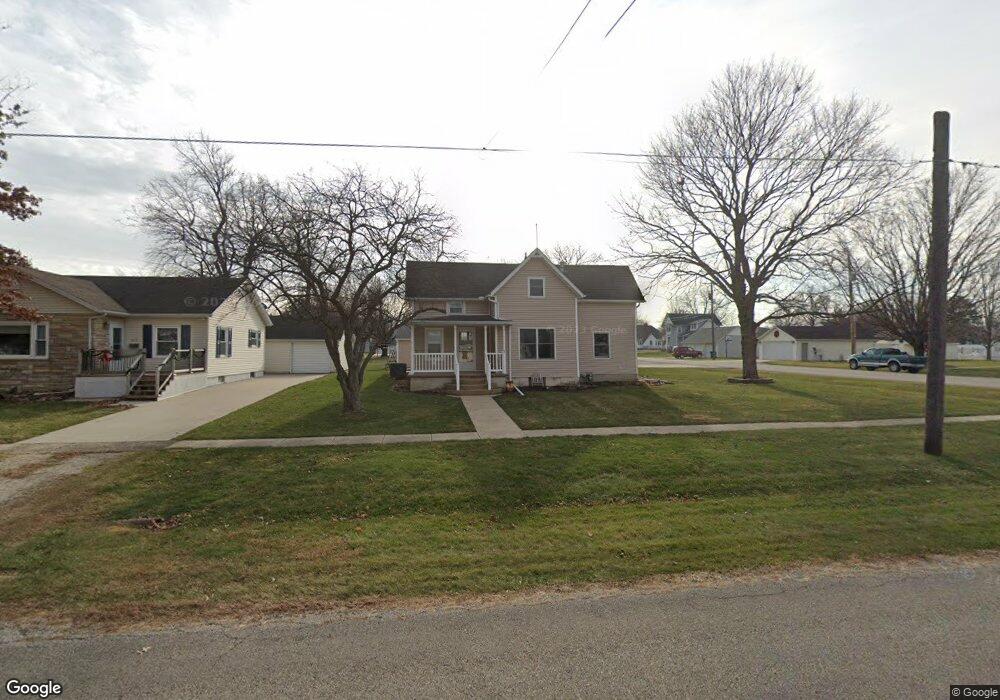
301 E 2nd St Atkinson, IL 61235
Estimated Value: $141,000 - $195,000
3
Beds
--
Bath
1,408
Sq Ft
$118/Sq Ft
Est. Value
About This Home
This home is located at 301 E 2nd St, Atkinson, IL 61235 and is currently estimated at $166,581, approximately $118 per square foot. 301 E 2nd St is a home located in Henry County with nearby schools including Geneseo High School.
Create a Home Valuation Report for This Property
The Home Valuation Report is an in-depth analysis detailing your home's value as well as a comparison with similar homes in the area
Tax History
| Year | Tax Paid | Tax Assessment Tax Assessment Total Assessment is a certain percentage of the fair market value that is determined by local assessors to be the total taxable value of land and additions on the property. | Land | Improvement |
|---|---|---|---|---|
| 2024 | $4,067 | $57,572 | $4,402 | $53,170 |
| 2023 | $3,641 | $53,111 | $4,061 | $49,050 |
| 2022 | $3,395 | $48,905 | $3,739 | $45,166 |
| 2021 | $3,194 | $45,282 | $3,462 | $41,820 |
| 2020 | $3,074 | $44,066 | $3,369 | $40,697 |
| 2019 | $3,018 | $43,408 | $3,319 | $40,089 |
| 2018 | $2,954 | $42,143 | $3,222 | $38,921 |
| 2017 | $2,870 | $41,035 | $3,137 | $37,898 |
| 2016 | $2,866 | $40,830 | $3,121 | $37,709 |
| 2015 | $1,742 | $40,830 | $3,121 | $37,709 |
| 2013 | $1,742 | $41,243 | $3,153 | $38,090 |
Source: Public Records
Map
Nearby Homes
- 420 Margaret St
- 203 Hamilton St
- 22308 N 2120th Ave
- 502 W Front St
- 108 S Main St
- 317 N Canal St
- 000 Hennepin Canal Parkway Trail
- 8 Pine Ridge Ln
- 918 S Chicago St
- 524 E Chestnut St
- 944 S Iowa St Unit 2
- 500 E Pearl St
- 623 E Park St
- 310 Hillcrest Dr
- 00 N Chicago St
- 817 S Illinois St
- 549 E Park St
- 0 S Oakwood Ave Unit MRDQC4257560
- 224 Pin Oak Dr
- 721 Ash Dr
Your Personal Tour Guide
Ask me questions while you tour the home.