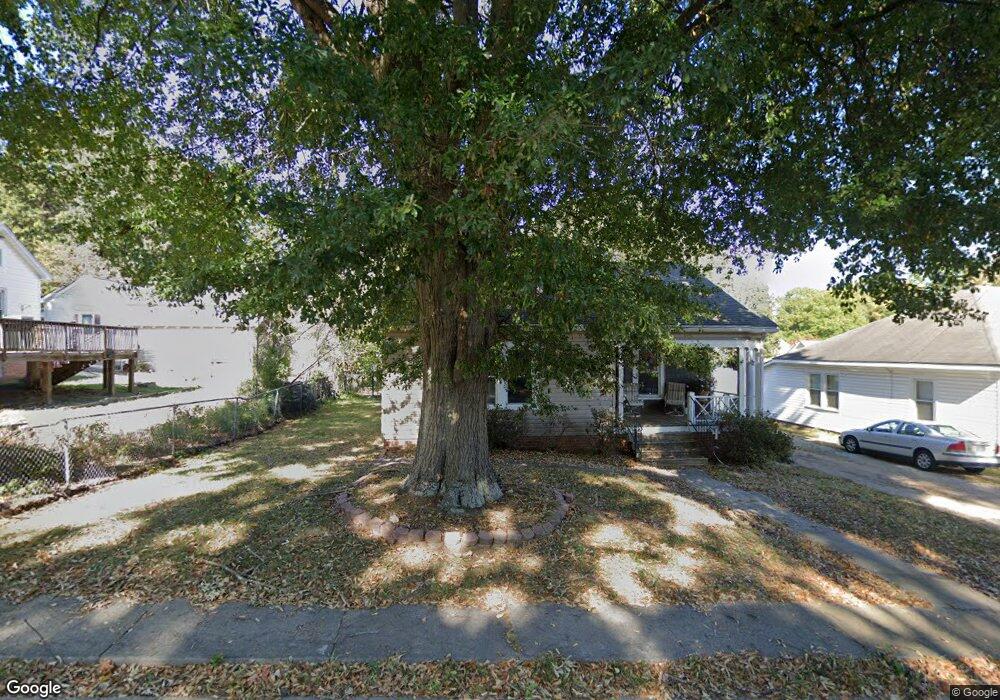
301 E 3rd St Kannapolis, NC 28083
Estimated Value: $218,000 - $253,000
2
Beds
1
Bath
1,295
Sq Ft
$176/Sq Ft
Est. Value
About This Home
This home is located at 301 E 3rd St, Kannapolis, NC 28083 and is currently estimated at $227,799, approximately $175 per square foot. 301 E 3rd St is a home located in Cabarrus County with nearby schools including North Kannapolis Elementary School, Kannapolis Middle, and A.L. Brown High School.
Ownership History
Date
Name
Owned For
Owner Type
Purchase Details
Closed on
Apr 15, 2023
Sold by
Griggs Cynthia S and Griggs Farrar O
Bought by
Griggs Farrar O and Griggs Cynthia S
Current Estimated Value
Purchase Details
Closed on
Jun 7, 2012
Sold by
Griggs Farrar
Bought by
Griggs Cynthia S
Purchase Details
Closed on
Apr 16, 2003
Sold by
Shopf Rebecca Lynne
Bought by
Griggs Farrar
Home Financials for this Owner
Home Financials are based on the most recent Mortgage that was taken out on this home.
Original Mortgage
$74,620
Interest Rate
5.62%
Purchase Details
Closed on
Dec 17, 1999
Sold by
Rodgers Scott C and Rodgers Kristin T
Bought by
Shopf Rebecca Lynne
Home Financials for this Owner
Home Financials are based on the most recent Mortgage that was taken out on this home.
Original Mortgage
$73,000
Interest Rate
7.85%
Purchase Details
Closed on
Nov 1, 1994
Bought by
Rodgers Scott Cameron
Create a Home Valuation Report for This Property
The Home Valuation Report is an in-depth analysis detailing your home's value as well as a comparison with similar homes in the area
Home Values in the Area
Average Home Value in this Area
Purchase History
| Date | Buyer | Sale Price | Title Company |
|---|---|---|---|
| Griggs Farrar O | -- | None Listed On Document | |
| Griggs Cynthia S | -- | None Available | |
| Griggs Farrar | $74,000 | -- | |
| Shopf Rebecca Lynne | $75,500 | -- | |
| Rodgers Scott Cameron | $42,000 | -- |
Source: Public Records
Mortgage History
| Date | Status | Borrower | Loan Amount |
|---|---|---|---|
| Previous Owner | Griggs Farrar | $74,620 | |
| Previous Owner | Shopf Rebecca Lynne | $73,000 |
Source: Public Records
Tax History
| Year | Tax Paid | Tax Assessment Tax Assessment Total Assessment is a certain percentage of the fair market value that is determined by local assessors to be the total taxable value of land and additions on the property. | Land | Improvement |
|---|---|---|---|---|
| 2025 | $2,263 | $199,320 | $44,000 | $155,320 |
| 2024 | $2,263 | $199,320 | $44,000 | $155,320 |
| 2023 | $1,591 | $116,150 | $32,000 | $84,150 |
| 2022 | $1,591 | $116,150 | $32,000 | $84,150 |
| 2021 | $1,591 | $116,150 | $32,000 | $84,150 |
| 2020 | $1,591 | $116,150 | $32,000 | $84,150 |
| 2019 | $1,169 | $85,330 | $15,300 | $70,030 |
| 2018 | $1,152 | $85,330 | $15,300 | $70,030 |
| 2017 | $1,135 | $85,330 | $15,300 | $70,030 |
| 2016 | $1,135 | $87,960 | $20,700 | $67,260 |
| 2015 | $1,108 | $87,960 | $20,700 | $67,260 |
| 2014 | $1,108 | $87,960 | $20,700 | $67,260 |
Source: Public Records
Map
Nearby Homes
- 419 N East Ave
- 200 Martin Luther King Junior Ave
- 510 N East Ave
- 399 Janie St
- 535 Martin Luther King Junior Ave
- 541 Martin Luther King Junior Ave
- 606 N Juniper Ave
- 514 Jackson Park Rd
- 606 Jackson St
- 601 W 7th St
- 911 N Walnut St
- 306 York Ave
- 303 E 10th St
- 123 James St
- 602 W 8th St
- 351 Old Centergrove Rd
- 600 W 8th St
- 315 S Rose Ave
- 604 W 8th St
- 600 Foster St
Your Personal Tour Guide
Ask me questions while you tour the home.