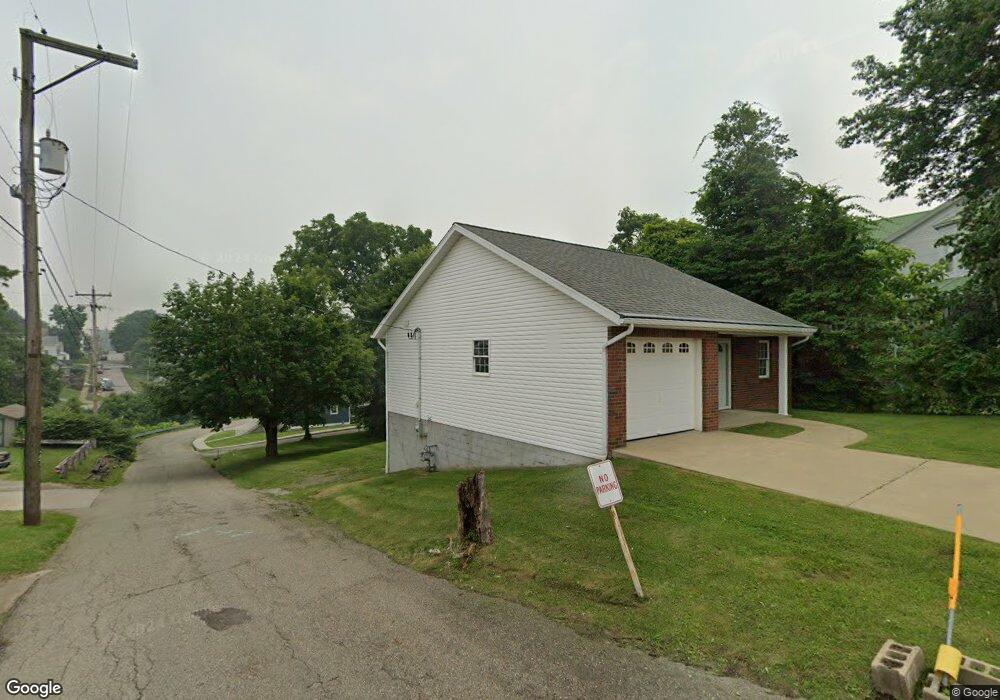
301 E Main St Barnesville, OH 43713
Estimated Value: $141,000 - $190,000
2
Beds
2
Baths
828
Sq Ft
$200/Sq Ft
Est. Value
About This Home
This home is located at 301 E Main St, Barnesville, OH 43713 and is currently estimated at $165,810, approximately $200 per square foot. 301 E Main St is a home located in Belmont County with nearby schools including Barnesville Elementary School, Barnesville Middle School, and Barnesville High School.
Ownership History
Date
Name
Owned For
Owner Type
Purchase Details
Closed on
Jun 6, 2024
Sold by
Robert P Wurm Keystone Inheritance Trust and Noel Catherine
Bought by
Laity George R and Laity Jennifer
Current Estimated Value
Purchase Details
Closed on
Apr 2, 2012
Sold by
Swallie William A and Swallie Ramona E
Bought by
Kovacs Karen
Purchase Details
Closed on
Oct 19, 2009
Sold by
Mayberry Gerald F
Bought by
Noel Catherine and The Robert P Wurm Keystone Inh
Purchase Details
Closed on
Feb 10, 2009
Sold by
Wesbanco Bank Inc
Bought by
Mayberry Gerald F
Purchase Details
Closed on
Oct 7, 2008
Sold by
Helms Lisa C and Case #08 Cv 132
Bought by
Wesbanco Bank Inc
Purchase Details
Closed on
Feb 23, 1995
Sold by
Helms Lisa Claire
Bought by
Helms Lisa Claire
Purchase Details
Closed on
Jan 1, 1986
Sold by
Niehaus Carol B
Bought by
Niehaus Carol B
Create a Home Valuation Report for This Property
The Home Valuation Report is an in-depth analysis detailing your home's value as well as a comparison with similar homes in the area
Home Values in the Area
Average Home Value in this Area
Purchase History
| Date | Buyer | Sale Price | Title Company |
|---|---|---|---|
| Laity George R | $233,333 | Northwest Title | |
| Kovacs Karen | -- | Attorney | |
| Noel Catherine | $120,000 | None Available | |
| Mayberry Gerald F | $8,000 | Attorney | |
| Wesbanco Bank Inc | $9,000 | Attorney | |
| Helms Lisa Claire | $25,000 | -- | |
| Niehaus Carol B | -- | -- |
Source: Public Records
Tax History
| Year | Tax Paid | Tax Assessment Tax Assessment Total Assessment is a certain percentage of the fair market value that is determined by local assessors to be the total taxable value of land and additions on the property. | Land | Improvement |
|---|---|---|---|---|
| 2025 | $1,907 | $56,720 | $2,420 | $54,300 |
| 2023 | $1,987 | $57,560 | $2,040 | $55,520 |
| 2022 | $1,986 | $57,564 | $2,044 | $55,520 |
| 2021 | $1,992 | $57,564 | $2,044 | $55,520 |
| 2020 | $1,735 | $47,970 | $1,700 | $46,270 |
| 2019 | $1,738 | $47,970 | $1,700 | $46,270 |
| 2018 | $1,727 | $47,970 | $1,700 | $46,270 |
| 2017 | $1,697 | $46,060 | $4,400 | $41,660 |
| 2016 | $1,589 | $46,060 | $4,400 | $41,660 |
| 2015 | $1,664 | $46,060 | $4,400 | $41,660 |
| 2014 | $1,326 | $38,150 | $4,000 | $34,150 |
| 2013 | $1,338 | $38,150 | $4,000 | $34,150 |
Source: Public Records
Map
Nearby Homes
- 152 E Main St
- 438 N Lincoln Ave
- 613 E Main St
- 126 Oak St
- 202 Walton Ave
- 617 Park St
- 618 Park St
- 724 E Main St
- 118 Pine Ln
- TBD W Main St
- 164 Pine Ln
- 0 Tract 17 Brown Peavine Rd Rd
- 0 Fairmont Ave Unit 5163774
- 0 Fairmont Ave Unit 5163784
- 62239 Hillcrest Rd
- 0 County Road 114
- Lot 1 Cattle Dr
- 0 Nevada Rd
- 57128 Somerton Hwy
- 0 Johnson Bethel Rd
- 309 E Main St
- 317 E Main St
- 319 E Main St
- 655 Church St
- 314 E Church St
- 402 E Church St
- 323 W Main St
- 320 Church St
- 185 E Main St
- 116 S Lincoln Ave
- 123 S Lincoln Ave
- 217 E Church St
- 118 S Lincoln Ave
- 137 E South St
- 137 E South St
- 120 S Lincoln Ave
- 115 S Arch St
- 208 N Lincoln Ave
- 337 E Main St
- 332 E Main St
Your Personal Tour Guide
Ask me questions while you tour the home.