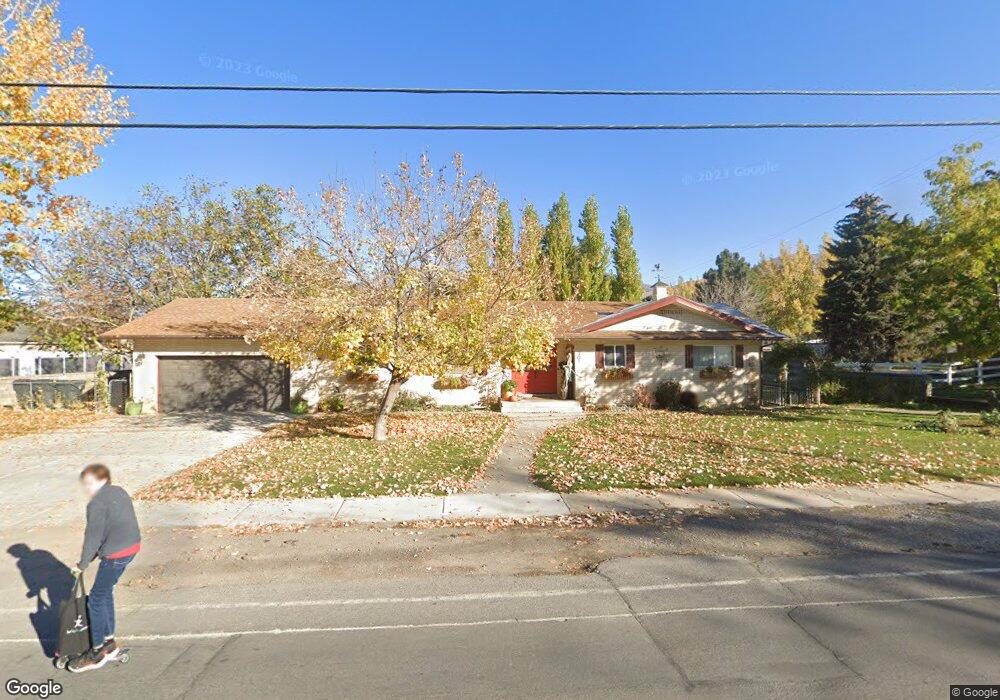
301 E Maple St Mapleton, UT 84664
Estimated Value: $802,000 - $1,210,000
3
Beds
5
Baths
2,391
Sq Ft
$386/Sq Ft
Est. Value
About This Home
This home is located at 301 E Maple St, Mapleton, UT 84664 and is currently estimated at $923,834, approximately $386 per square foot. 301 E Maple St is a home located in Utah County with nearby schools including Mapleton School, Mapleton Junior High School, and Maple Mountain High School.
Ownership History
Date
Name
Owned For
Owner Type
Purchase Details
Closed on
Oct 9, 2020
Sold by
Keele Samuel S and Keele Sherrie R
Bought by
Keele Samuel Sansom and Keele Sherrie R
Current Estimated Value
Home Financials for this Owner
Home Financials are based on the most recent Mortgage that was taken out on this home.
Original Mortgage
$390,000
Outstanding Balance
$346,884
Interest Rate
2.9%
Mortgage Type
New Conventional
Estimated Equity
$576,950
Purchase Details
Closed on
Aug 27, 2015
Sold by
Henry Robert Grady and Henry Celinda
Bought by
Keele Samuel S and Keele Sherrie R
Home Financials for this Owner
Home Financials are based on the most recent Mortgage that was taken out on this home.
Original Mortgage
$242,771
Interest Rate
4.75%
Mortgage Type
FHA
Create a Home Valuation Report for This Property
The Home Valuation Report is an in-depth analysis detailing your home's value as well as a comparison with similar homes in the area
Home Values in the Area
Average Home Value in this Area
Purchase History
| Date | Buyer | Sale Price | Title Company |
|---|---|---|---|
| Keele Samuel Sansom | -- | Highland Title | |
| Keele Samuel S | -- | Greenbrier Title Ins Ag |
Source: Public Records
Mortgage History
| Date | Status | Borrower | Loan Amount |
|---|---|---|---|
| Open | Keele Samuel Sansom | $390,000 | |
| Closed | Keele Samuel S | $242,771 |
Source: Public Records
Tax History
| Year | Tax Paid | Tax Assessment Tax Assessment Total Assessment is a certain percentage of the fair market value that is determined by local assessors to be the total taxable value of land and additions on the property. | Land | Improvement |
|---|---|---|---|---|
| 2025 | $3,909 | $425,975 | -- | -- |
| 2024 | $3,909 | $382,910 | $0 | $0 |
| 2023 | $3,999 | $394,185 | $0 | $0 |
| 2022 | $3,867 | $376,915 | $0 | $0 |
| 2021 | $3,235 | $484,200 | $186,000 | $298,200 |
| 2020 | $3,197 | $462,800 | $164,600 | $298,200 |
| 2019 | $2,824 | $417,200 | $157,900 | $259,300 |
| 2018 | $2,606 | $366,500 | $133,000 | $233,500 |
| 2017 | $2,639 | $197,010 | $0 | $0 |
| 2016 | $2,397 | $177,870 | $0 | $0 |
| 2015 | $2,226 | $164,175 | $0 | $0 |
| 2014 | $2,042 | $147,895 | $0 | $0 |
Source: Public Records
Map
Nearby Homes
- 415 E Maple St
- 141 N 600 E
- 745 E Maple St
- 84 E 530 N
- 162 N 800 E
- 265 E 600 N
- 310 N 800 E
- 1377 E Maple St
- 775 N 800 E
- 594 E 1000 N
- 897 N Main St
- 435 E 1000 N
- 509 W 350 S Unit 30
- 4664 S 680 W Unit S204
- 4664 S 680 W Unit S203
- 4664 S 680 W Unit S302
- 4664 S 680 W Unit S303
- 4664 S 680 W Unit S201
- 4664 S 680 W Unit S202
- 4664 S 680 W Unit S304
Your Personal Tour Guide
Ask me questions while you tour the home.