301 Lancaster Ave Prospect Heights, IL 60070
Prospect Heights AreaEstimated Value: $593,000 - $764,000
About This Home
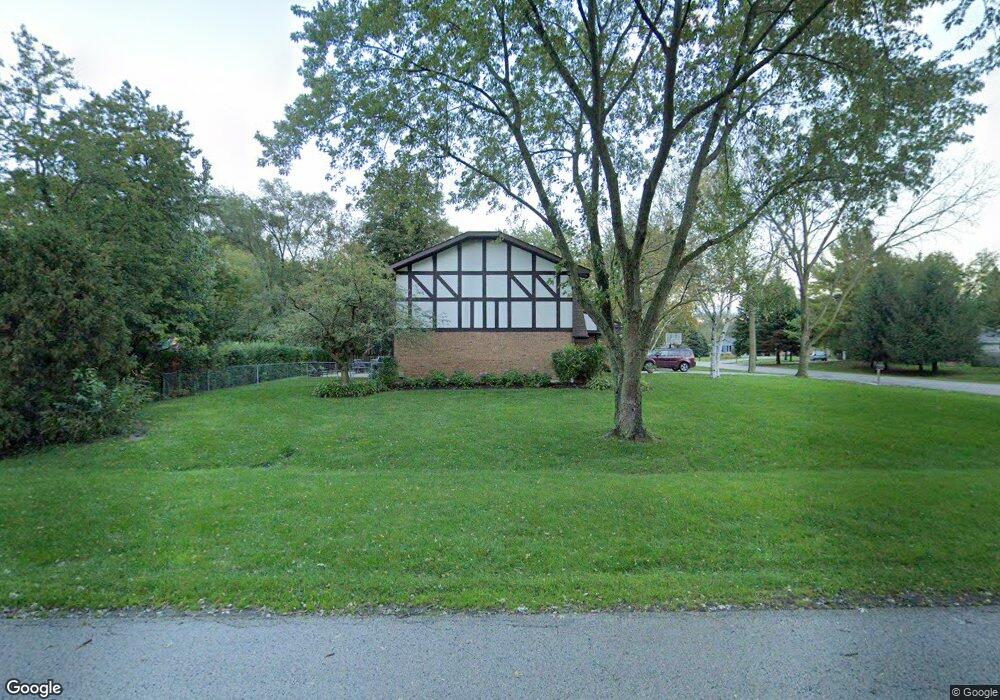
This home is located at 301 Lancaster Ave, Prospect Heights, IL 60070 and is currently estimated at $685,199, approximately $276 per square foot. 301 Lancaster Ave is a home located in Cook County with nearby schools including Dwight D Eisenhower Elementary School, Anne Sullivan Elementary School, and Betsy Ross Elementary School.
Ownership History
We collect this data history from publicly available records. To have your information removed, we recommend requesting removal directly through your county’s website.
Purchase Details
Home Financials for this Owner
Home Financials are based on the most recent Mortgage that was taken out on this home.Home Values in the Area
Average Home Value in this Area
Purchase History
We collect this data history from publicly available records. To have your information removed, we recommend requesting removal directly through your county’s website.
| Date | Buyer | Sale Price | Title Company |
|---|---|---|---|
| $425,000 | -- |
Mortgage History
We collect this data history from publicly available records. To have your information removed, we recommend requesting removal directly through your county’s website.
| Date | Status | Borrower | Loan Amount |
|---|---|---|---|
| Open | $290,000 |
Tax History
We collect this data history from publicly available records. To have your information removed, we recommend requesting removal directly through your county’s website.
| Year | Tax Paid | Tax Assessment Tax Assessment Total Assessment is a certain percentage of the fair market value that is determined by local assessors to be the total taxable value of land and additions on the property. | Land | Improvement |
|---|---|---|---|---|
| 2025 | $11,553 | $59,001 | $10,063 | $48,938 |
| 2024 | $11,553 | $40,341 | $8,050 | $32,291 |
| 2023 | $10,802 | $41,756 | $8,050 | $33,706 |
| 2022 | $10,802 | $41,756 | $8,050 | $33,706 |
| 2021 | $10,927 | $36,654 | $7,043 | $29,611 |
| 2020 | $10,654 | $36,654 | $7,043 | $29,611 |
| 2019 | $10,649 | $41,001 | $7,043 | $33,958 |
| 2018 | $10,434 | $37,186 | $6,037 | $31,149 |
| 2017 | $10,851 | $38,874 | $6,037 | $32,837 |
| 2016 | $11,461 | $42,780 | $6,037 | $36,743 |
| 2015 | $9,935 | $34,244 | $5,031 | $29,213 |
| 2014 | $9,847 | $34,244 | $5,031 | $29,213 |
| 2013 | $10,245 | $36,415 | $5,031 | $31,384 |
Map
- 404 Tomah Ave
- 2407 E Olive St Unit 2F
- 1615 N Dale Ave Unit 1
- 2315 E Olive St Unit 1G
- 204 Linden Rd S
- 504 N Schoenbeck Rd
- 2434 E Brandenberry Ct Unit 2A
- 2019 E Avon Ln
- 1110 N Dale Ave Unit 1K
- 1541 N Kendal Ct Unit 41541
- 1911 N Silver Lake Rd Unit 55
- 1621 N Windsor Dr Unit 215
- 1951 N Stillwater Rd Unit 162
- 1955 N Stillwater Rd Unit 147
- 1953 N Coldspring Rd Unit 68
- 1627 N Windsor Dr Unit 305
- 1721 N Wilshire Ave
- 1311 Nutmeg Ct Unit B
- 1401 Plum Ct Unit D
- 1309 Nutmeg Ct Unit A
- 507 W Willow Rd
- 305 Lancaster Ave
- 505 W Willow Rd
- 303 Lancaster Ave
- 504 Frankie Ct
- 2657 E Yarmouth Ct
- 502 Frankie Ct
- 2659 E Yarmouth Ct
- 308 Dale Ave
- 2655 E Yarmouth Ct
- 306 Dale Ave
- 1511 N Howard Ct
- 601 W Willow Rd
- 306 Lancaster Ave
- 1507 N Howard Ct
- 2660 E Yarmouth Ct
- 500 Frankie Ct
- 1504 N Howard Ct
- 304 Dale Ave
- 2653 E Yarmouth Ct
Ask me questions while you tour the home.