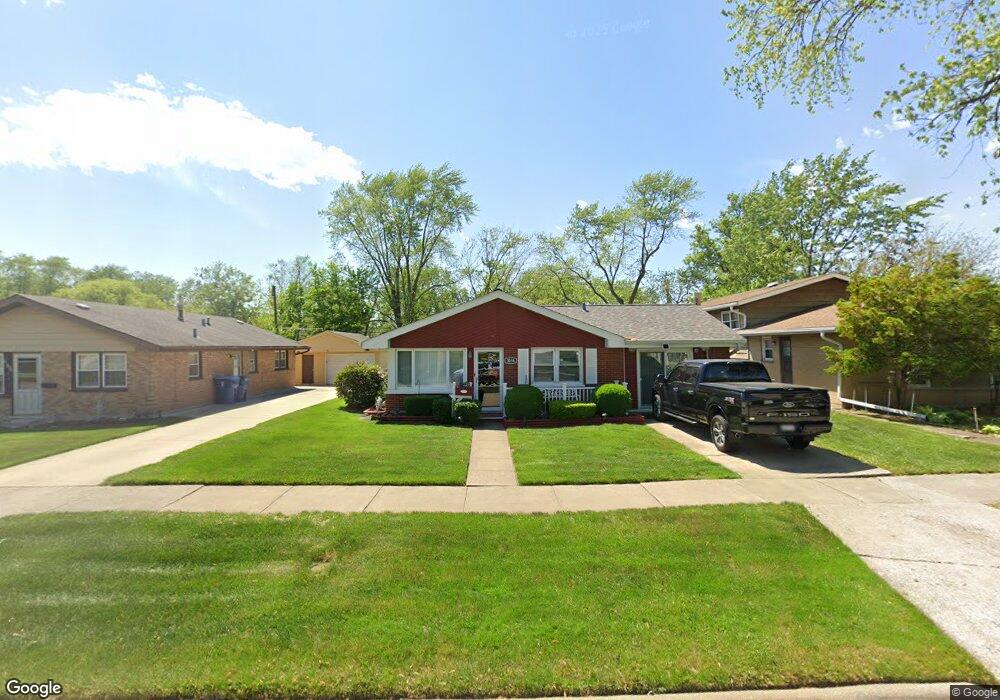
3016 Butler Ave Steger, IL 60475
Estimated Value: $154,000 - $194,000
3
Beds
1
Bath
1,325
Sq Ft
$135/Sq Ft
Est. Value
About This Home
This home is located at 3016 Butler Ave, Steger, IL 60475 and is currently estimated at $179,202, approximately $135 per square foot. 3016 Butler Ave is a home located in Cook County with nearby schools including Steger Primary Center, Steger Intermediate Center, and Columbia Central School.
Ownership History
Date
Name
Owned For
Owner Type
Purchase Details
Closed on
May 18, 2004
Sold by
Stanford Jennifer
Bought by
Ward James
Current Estimated Value
Home Financials for this Owner
Home Financials are based on the most recent Mortgage that was taken out on this home.
Original Mortgage
$106,650
Outstanding Balance
$56,124
Interest Rate
7.62%
Mortgage Type
Unknown
Estimated Equity
$123,078
Purchase Details
Closed on
Dec 17, 1999
Sold by
Miller Charles L and Miller Charity S
Bought by
Stanford Jennifer
Home Financials for this Owner
Home Financials are based on the most recent Mortgage that was taken out on this home.
Original Mortgage
$82,350
Interest Rate
8.37%
Purchase Details
Closed on
Aug 11, 1995
Sold by
Miller Henry E
Bought by
Miller Charles L and Miller Charity S
Purchase Details
Closed on
Sep 17, 1993
Sold by
Miller Charles L and Miller Henry E
Bought by
Miller Charles L and Miller Charity S
Create a Home Valuation Report for This Property
The Home Valuation Report is an in-depth analysis detailing your home's value as well as a comparison with similar homes in the area
Home Values in the Area
Average Home Value in this Area
Purchase History
We collect this data history from publicly available records. To have your information removed, we recommend requesting removal directly through your county’s website.
| Date | Buyer | Sale Price | Title Company |
|---|---|---|---|
| Ward James | $118,500 | Pntn | |
| Stanford Jennifer | $91,500 | -- | |
| Miller Charles L | -- | -- | |
| Miller Charles L | -- | Equity Title |
Source: Public Records
Mortgage History
We collect this data history from publicly available records. To have your information removed, we recommend requesting removal directly through your county’s website.
| Date | Status | Borrower | Loan Amount |
|---|---|---|---|
| Open | Ward James | $106,650 | |
| Previous Owner | Stanford Jennifer | $82,350 |
Source: Public Records
Tax History
| Year | Tax Paid | Tax Assessment Tax Assessment Total Assessment is a certain percentage of the fair market value that is determined by local assessors to be the total taxable value of land and additions on the property. | Land | Improvement |
|---|---|---|---|---|
| 2025 | $2,253 | $10,120 | $2,188 | $7,932 |
| 2024 | $2,253 | $10,120 | $2,188 | $7,932 |
| 2023 | $2,292 | $10,120 | $2,188 | $7,932 |
| 2022 | $2,292 | $9,079 | $1,875 | $7,204 |
| 2021 | $2,174 | $9,078 | $1,875 | $7,203 |
| 2020 | $2,215 | $9,078 | $1,875 | $7,203 |
| 2019 | $2,099 | $9,242 | $1,718 | $7,524 |
| 2018 | $2,027 | $9,242 | $1,718 | $7,524 |
| 2017 | $2,074 | $9,242 | $1,718 | $7,524 |
| 2016 | $2,239 | $8,754 | $1,562 | $7,192 |
| 2015 | $2,185 | $8,754 | $1,562 | $7,192 |
| 2014 | $2,199 | $8,754 | $1,562 | $7,192 |
| 2013 | $2,092 | $9,071 | $1,562 | $7,509 |
Source: Public Records
Map
Nearby Homes
- 3120 Florence Ave
- 3225 Butler Ave
- 3241 Wallace Ave
- 3300 Butler Ave
- 3025 Sandy Ridge Dr
- 3117 Chicago Rd
- 3121 Chicago Rd
- 111 E 34th St
- 14 W 31st St
- 3333 Union Ave
- 17 W 30th Place
- 13 W 30th Place
- 3417 Butler Ave
- 29 W 31st Place
- 3245 Halsted St
- 274 E 34th St
- 205 Hereford Ave
- 3515 Union Ave
- 3005 Commercial Ave
- 223 Tinbury Ln
- 3020 Butler Ave
- 3012 Butler Ave
- 3024 Butler Ave
- 3008 Butler Ave
- 3008 Butler Ave
- 3017 Florence Ave
- 3004 Butler Ave
- 3021 Florence Ave
- 3015 Florence Ave
- 3028 Butler Ave
- 3009 Florence Ave
- 3025 Florence Ave
- 3000 Butler Ave
- 3000 Butler Ave
- 3015 Butler Ave
- 3021 Butler Ave
- 3032 Butler Ave
- 3011 Butler Ave
- 3005 Florence Ave
- 3029 Butler Ave
Your Personal Tour Guide
Ask me questions while you tour the home.