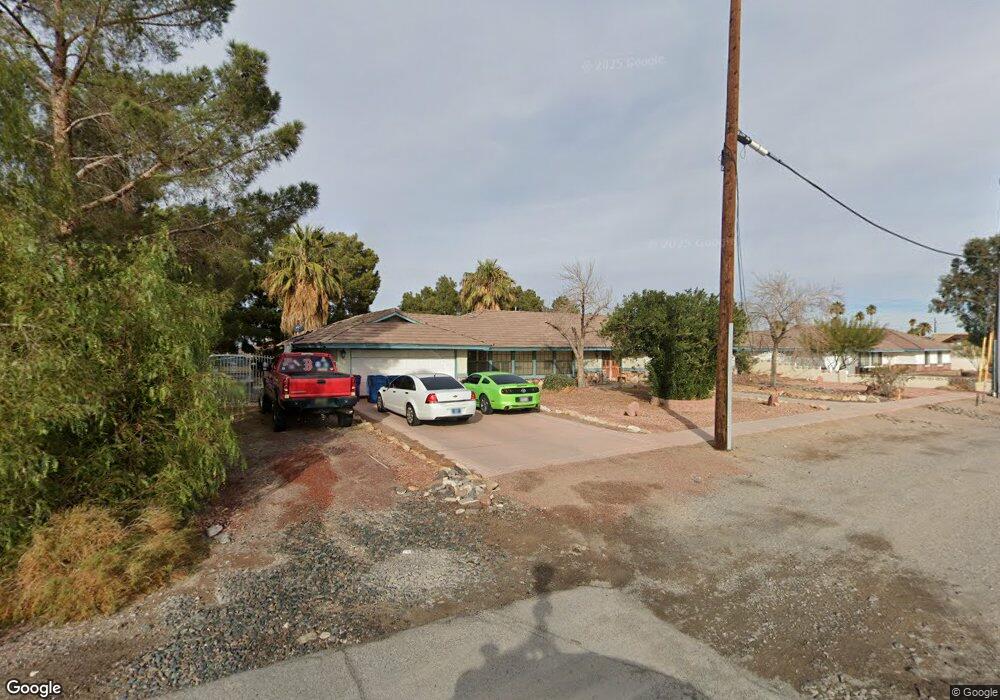
3019 Belmont Dr Henderson, NV 89074
Green Valley South NeighborhoodEstimated Value: $765,000 - $833,000
5
Beds
3
Baths
3,052
Sq Ft
$263/Sq Ft
Est. Value
About This Home
This home is located at 3019 Belmont Dr, Henderson, NV 89074 and is currently estimated at $803,075, approximately $263 per square foot. 3019 Belmont Dr is a home located in Clark County with nearby schools including John Vanderburg Elementary School, Neil C. Twitchell Elementary School, and Bob Miller Middle School.
Ownership History
Date
Name
Owned For
Owner Type
Purchase Details
Closed on
Jan 18, 2011
Sold by
Italiano Nelson P and Italiano Carletta G
Bought by
Laub Theodore Q
Current Estimated Value
Home Financials for this Owner
Home Financials are based on the most recent Mortgage that was taken out on this home.
Original Mortgage
$238,789
Outstanding Balance
$165,934
Interest Rate
5.5%
Mortgage Type
FHA
Estimated Equity
$637,141
Purchase Details
Closed on
Oct 7, 2003
Sold by
Toma Mary and Toma Isaac
Bought by
Italiano Nelson P and Italiano Carletta G
Home Financials for this Owner
Home Financials are based on the most recent Mortgage that was taken out on this home.
Original Mortgage
$283,500
Interest Rate
6.27%
Mortgage Type
Unknown
Purchase Details
Closed on
Oct 5, 1998
Sold by
Mayfield Seaynoah and Mayfield Helen J
Bought by
Alexander Thomas James and Alexander Tatiana
Home Financials for this Owner
Home Financials are based on the most recent Mortgage that was taken out on this home.
Original Mortgage
$175,000
Interest Rate
6.71%
Create a Home Valuation Report for This Property
The Home Valuation Report is an in-depth analysis detailing your home's value as well as a comparison with similar homes in the area
Home Values in the Area
Average Home Value in this Area
Purchase History
We collect this data history from publicly available records. To have your information removed, we recommend requesting removal directly through your county’s website.
| Date | Buyer | Sale Price | Title Company |
|---|---|---|---|
| Laub Theodore Q | $245,000 | Lawyers Title Of Nevada Vil | |
| Italiano Nelson P | $309,000 | Ticor Title Of Nevada Inc | |
| Alexander Thomas James | -- | Land Title |
Source: Public Records
Mortgage History
We collect this data history from publicly available records. To have your information removed, we recommend requesting removal directly through your county’s website.
| Date | Status | Borrower | Loan Amount |
|---|---|---|---|
| Open | Laub Theodore Q | $238,789 | |
| Previous Owner | Italiano Nelson P | $283,500 | |
| Previous Owner | Alexander Thomas James | $175,000 |
Source: Public Records
Tax History
| Year | Tax Paid | Tax Assessment Tax Assessment Total Assessment is a certain percentage of the fair market value that is determined by local assessors to be the total taxable value of land and additions on the property. | Land | Improvement |
|---|---|---|---|---|
| 2026 | $3,713 | $197,137 | $98,000 | $99,137 |
| 2025 | $3,605 | $200,127 | $98,000 | $102,127 |
| 2024 | $3,500 | $200,127 | $98,000 | $102,127 |
| 2023 | $3,500 | $166,790 | $70,000 | $96,790 |
| 2022 | $3,398 | $154,049 | $64,750 | $89,299 |
| 2021 | $3,299 | $141,141 | $56,000 | $85,141 |
| 2020 | $3,200 | $137,317 | $52,500 | $84,817 |
| 2019 | $3,107 | $132,943 | $49,000 | $83,943 |
| 2018 | $3,017 | $124,978 | $43,750 | $81,228 |
| 2017 | $3,269 | $112,786 | $35,000 | $77,786 |
| 2016 | $2,856 | $110,984 | $28,000 | $82,984 |
| 2015 | $2,851 | $103,004 | $21,000 | $82,004 |
| 2014 | $2,768 | $92,698 | $14,000 | $78,698 |
Source: Public Records
Map
Nearby Homes
- 3020 Delano Dr
- 2196 Pescara Ct
- 0 Galena Dr
- 9484 Corato St
- 2904 Candelaria Dr
- 3061 E Serene Ave
- 2827 Belmont Dr
- 0 Richmar Ave
- 2037 Merano Ct
- 9530 Summersweet Ct Unit 4
- 9594 Summer Cypress St
- 2300 E Silverado Ranch Blvd Unit 2161
- 2300 E Silverado Ranch Blvd Unit 1021
- 2300 E Silverado Ranch Blvd Unit 1187
- 2300 E Silverado Ranch Blvd Unit 2158
- 2300 E Silverado Ranch Blvd Unit 1133
- 2300 E Silverado Ranch Blvd Unit 1158
- 2300 E Silverado Ranch Blvd Unit 1029
- 2300 E Silverado Ranch Blvd Unit 2135
- 2300 E Silverado Ranch Blvd Unit 1126
- 2541 E Serene Ave
- 2521 E Serene Ave
- 3015 Belmont Dr
- 2561 E Serene Ave
- 2540 E Serene Ave
- 2581 E Serene Ave
- 505 Goldhill Rd Unit B
- 0 Goldhill and Galena
- 3028 Candelaria Dr
- 0 E Serene Unit 2576470
- 0 E Serene Unit 2481686
- 0 E Serene Unit 2446994
- 3024 Candelaria Dr
- 0 0 Serene Near Manhattan
- 0 Goldhill Rd
- 2790 E Serene Ave
- 2928 Belmont Dr
- 3008 Delano Dr
- 2927 Candelaria Dr
- 2870 E Serene Ave
Your Personal Tour Guide
Ask me questions while you tour the home.