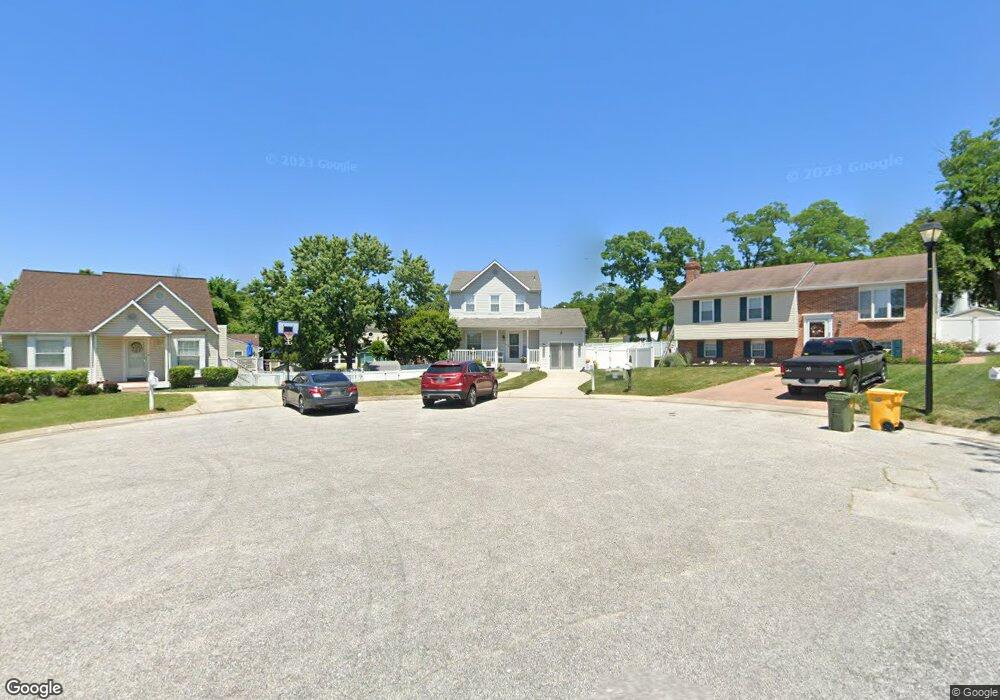
302 Dockside Ct Brooklyn, MD 21225
Estimated Value: $369,000 - $405,000
Studio
2
Baths
1,574
Sq Ft
$241/Sq Ft
Est. Value
About This Home
This home is located at 302 Dockside Ct, Brooklyn, MD 21225 and is currently estimated at $379,446, approximately $241 per square foot. 302 Dockside Ct is a home located in Anne Arundel County with nearby schools including Brooklyn Park Elementary School, Brooklyn Park Middle School, and North County High School.
Ownership History
Date
Name
Owned For
Owner Type
Purchase Details
Closed on
Oct 11, 2016
Bought by
Mckenzie George
Current Estimated Value
Home Financials for this Owner
Home Financials are based on the most recent Mortgage that was taken out on this home.
Original Mortgage
$222,900
Outstanding Balance
$178,469
Interest Rate
3.42%
Estimated Equity
$200,977
Purchase Details
Closed on
Oct 4, 1994
Sold by
Mangum Patrick D
Bought by
Mckenzie George
Home Financials for this Owner
Home Financials are based on the most recent Mortgage that was taken out on this home.
Original Mortgage
$123,750
Interest Rate
8.5%
Purchase Details
Closed on
Dec 9, 1987
Sold by
Wooded Valley Assocs
Bought by
Mangum Patrick D
Home Financials for this Owner
Home Financials are based on the most recent Mortgage that was taken out on this home.
Original Mortgage
$94,600
Interest Rate
10.6%
Create a Home Valuation Report for This Property
The Home Valuation Report is an in-depth analysis detailing your home's value as well as a comparison with similar homes in the area
Home Values in the Area
Average Home Value in this Area
Purchase History
| Date | Buyer | Sale Price | Title Company |
|---|---|---|---|
| Mckenzie George | -- | -- | |
| Mckenzie George | $137,500 | -- | |
| Mangum Patrick D | $105,600 | -- |
Source: Public Records
Mortgage History
| Date | Status | Borrower | Loan Amount |
|---|---|---|---|
| Open | Mckenzie George | $222,900 | |
| Closed | Mckenzie George | -- | |
| Previous Owner | Mckenzie George | $123,750 | |
| Previous Owner | Mangum Patrick D | $94,600 |
Source: Public Records
Tax History
| Year | Tax Paid | Tax Assessment Tax Assessment Total Assessment is a certain percentage of the fair market value that is determined by local assessors to be the total taxable value of land and additions on the property. | Land | Improvement |
|---|---|---|---|---|
| 2025 | $2,858 | $301,200 | $105,200 | $196,000 |
| 2024 | $2,858 | $292,267 | $0 | $0 |
| 2023 | $2,300 | $283,333 | $0 | $0 |
| 2022 | $2,588 | $274,400 | $105,200 | $169,200 |
| 2020 | $2,451 | $253,067 | $0 | $0 |
| 2019 | $2,406 | $242,400 | $93,000 | $149,400 |
| 2018 | $2,392 | $235,900 | $0 | $0 |
| 2017 | $2,269 | $229,400 | $0 | $0 |
| 2016 | -- | $222,900 | $0 | $0 |
| 2015 | -- | $222,900 | $0 | $0 |
| 2014 | -- | $222,900 | $0 | $0 |
Source: Public Records
Map
Nearby Homes
- 5614 Cliff Side Ct
- 5655 Harbor Valley Dr
- 201 9th Ave
- 6028 A Belle Grove Rd
- 215 Grove Park Rd
- 944 1st St
- 932 1st St
- 923 1st St
- 915 1st St
- 17 2nd Ave
- 219 Doris Ave
- 336 Arden Rd W
- 5300 Brookwood Rd
- 216 Charles St
- 4106 Ritchie Hwy
- 5103 Ballman Ave
- 113 W Edgevale Rd
- 119 W Edgevale Rd
- 310 Townsend Ave
- 317 Doris Ave
Your Personal Tour Guide
Ask me questions while you tour the home.