302 Main St Buchanan, MI 49107
Estimated Value: $171,000 - $266,000
--
Bed
3
Baths
2,507
Sq Ft
$90/Sq Ft
Est. Value
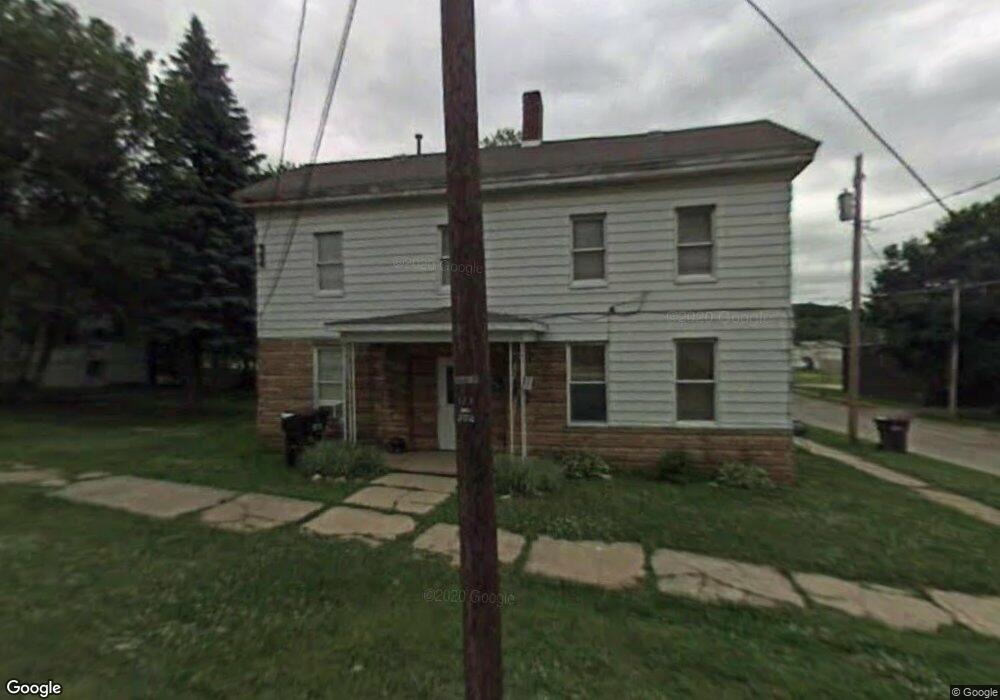
About This Home
This home is located at 302 Main St, Buchanan, MI 49107 and is currently estimated at $226,775, approximately $90 per square foot. 302 Main St is a home located in Berrien County with nearby schools including Ottawa Elementary School, Moccasin Elementary School, and Buchanan Middle School.
Ownership History
Date
Name
Owned For
Owner Type
Purchase Details
Closed on
Nov 5, 2021
Sold by
Berrien County Treasurer
Bought by
Panpan Iii Llc
Current Estimated Value
Purchase Details
Closed on
Dec 1, 1994
Purchase Details
Closed on
Sep 14, 1994
Purchase Details
Closed on
Jul 8, 1994
Purchase Details
Closed on
Jun 17, 1993
Purchase Details
Closed on
Jun 1, 1990
Purchase Details
Closed on
May 17, 1989
Purchase Details
Closed on
Mar 28, 1986
Purchase Details
Closed on
Jul 22, 1983
Purchase Details
Closed on
Feb 1, 1980
Purchase Details
Closed on
Dec 22, 1977
Create a Home Valuation Report for This Property
The Home Valuation Report is an in-depth analysis detailing your home's value as well as a comparison with similar homes in the area
Home Values in the Area
Average Home Value in this Area
Purchase History
| Date | Buyer | Sale Price | Title Company |
|---|---|---|---|
| Panpan Iii Llc | -- | None Listed On Document | |
| -- | -- | -- | |
| -- | $8,100 | -- | |
| -- | -- | -- | |
| -- | $36,200 | -- | |
| -- | $33,000 | -- | |
| -- | $33,000 | -- | |
| -- | -- | -- | |
| -- | -- | -- | |
| -- | -- | -- | |
| -- | $17,500 | -- |
Source: Public Records
Tax History
| Year | Tax Paid | Tax Assessment Tax Assessment Total Assessment is a certain percentage of the fair market value that is determined by local assessors to be the total taxable value of land and additions on the property. | Land | Improvement |
|---|---|---|---|---|
| 2025 | $578 | $21,800 | $0 | $0 |
| 2024 | $482 | $17,300 | $0 | $0 |
| 2023 | $463 | $8,400 | $0 | $0 |
| 2022 | $826 | $14,700 | $0 | $0 |
| 2021 | $1,033 | $12,900 | $3,600 | $9,300 |
| 2020 | $2,394 | $61,800 | $0 | $0 |
| 2019 | $2,127 | $56,500 | $2,900 | $53,600 |
Source: Public Records
Map
Nearby Homes
- 309 N Red Bud Trail
- 315 N Red Bud Trail
- 410 Main St
- 710 S Oak St
- 303 W Alexander St
- 314 Chippewa St
- 103 W Smith St
- 123 S Cayuga St
- 125 S Cayuga St
- 329 Chippewa St
- 1005 E Front St
- 1025 E Front St
- 315 Mc Cumber St
- 903 N Detroit St
- 118 Schirmer Pkwy
- 204 Terre Coupe St
- 415 Remus Dr
- 15902 Meadowview Dr
- 0 E River Rd
- 801 W Front St
Your Personal Tour Guide
Ask me questions while you tour the home.