302 Main St Buchanan, MI 49107
Estimated Value: $176,000 - $273,000
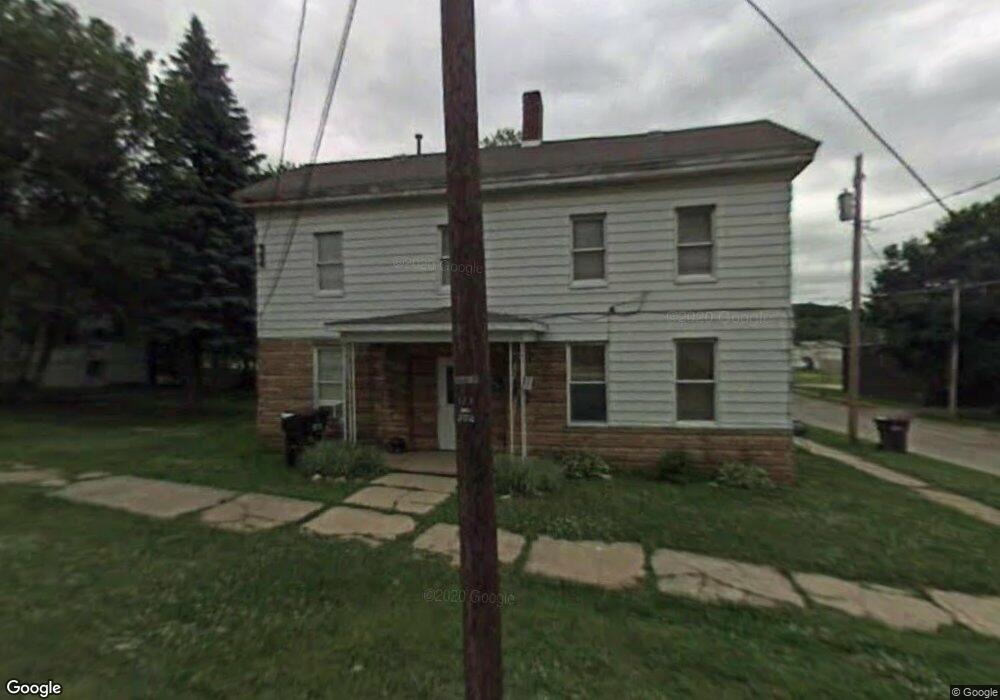
About This Home
This home is located at 302 Main St, Buchanan, MI 49107 and is currently estimated at $226,859, approximately $90 per square foot. 302 Main St is a home located in Berrien County with nearby schools including Ottawa Elementary School, Moccasin Elementary School, and Buchanan Middle School.
Ownership History
We collect this data history from publicly available records. To have your information removed, we recommend requesting removal directly through your county’s website.
Purchase Details
Purchase Details
Purchase Details
Purchase Details
Purchase Details
Purchase Details
Purchase Details
Purchase Details
Purchase Details
Purchase Details
Purchase Details
Home Values in the Area
Average Home Value in this Area
Purchase History
We collect this data history from publicly available records. To have your information removed, we recommend requesting removal directly through your county’s website.
| Date | Buyer | Sale Price | Title Company |
|---|---|---|---|
| -- | None Listed On Document | ||
| -- | -- | ||
| $8,100 | -- | ||
| -- | -- | ||
| $36,200 | -- | ||
| $33,000 | -- | ||
| $33,000 | -- | ||
| -- | -- | ||
| -- | -- | ||
| -- | -- | ||
| $17,500 | -- |
Tax History
We collect this data history from publicly available records. To have your information removed, we recommend requesting removal directly through your county’s website.
| Year | Tax Paid | Tax Assessment Tax Assessment Total Assessment is a certain percentage of the fair market value that is determined by local assessors to be the total taxable value of land and additions on the property. | Land | Improvement |
|---|---|---|---|---|
| 2026 | $591 | $31,000 | $0 | $0 |
| 2025 | $578 | $21,800 | $0 | $0 |
| 2024 | $482 | $17,300 | $0 | $0 |
| 2023 | $463 | $8,400 | $0 | $0 |
| 2022 | $826 | $14,700 | $0 | $0 |
| 2021 | $1,033 | $12,900 | $3,600 | $9,300 |
| 2020 | $2,394 | $61,800 | $0 | $0 |
| 2019 | $2,127 | $56,500 | $2,900 | $53,600 |
| 2018 | $2,668 | $56,500 | $0 | $0 |
| 2017 | $2,498 | $56,100 | $0 | $0 |
| 2016 | $2,698 | $55,400 | $0 | $0 |
| 2015 | $2,031 | $52,800 | $0 | $0 |
| 2014 | $1,994 | $50,200 | $0 | $0 |
Map
- 309 N Red Bud Trail
- 208 Moccasin St
- 113 W 5th St
- 506 Main St
- 110 Theoda Ct
- 710 S Oak St
- 401 Berrien St
- 312 W Chicago St
- 103 W Smith St
- 406 Elizabeth St
- 329 Chippewa St
- 313 Elizabeth St
- 1005 E Front St
- 1025 E Front St
- 703 Ottawa Ct
- 708 W Roe St
- 3297 W Front St
- 16172 Brookwood Dr
- 3720 Chamberlain Rd
- 16734 Rynearson Rd
Ask me questions while you tour the home.