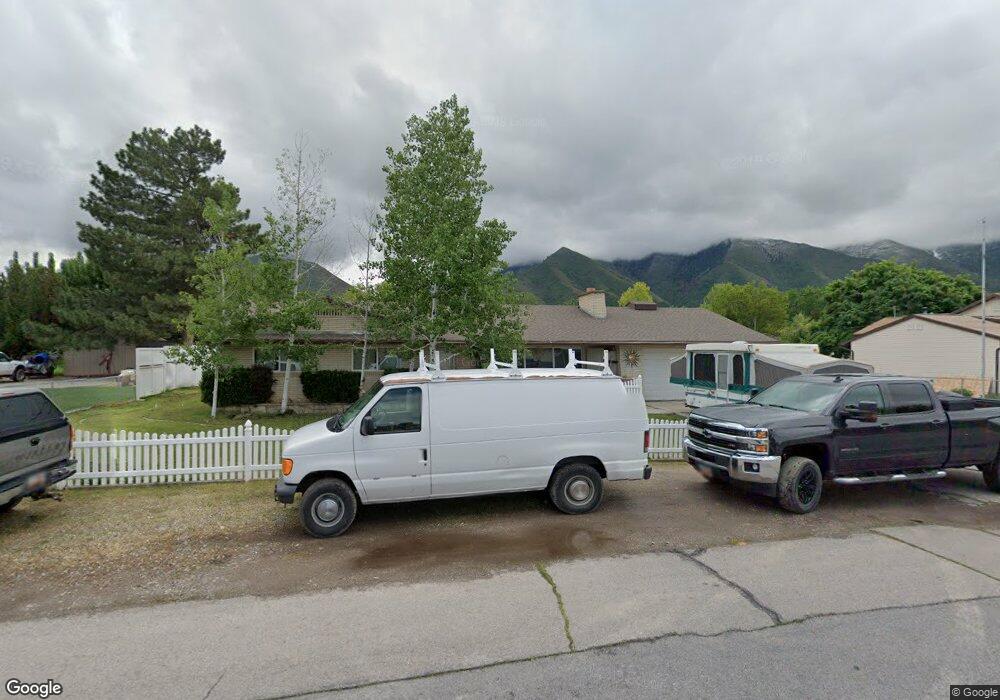
302 N 300 E Mapleton, UT 84664
Estimated Value: $576,686 - $681,000
3
Beds
2
Baths
1,963
Sq Ft
$317/Sq Ft
Est. Value
About This Home
This home is located at 302 N 300 E, Mapleton, UT 84664 and is currently estimated at $621,922, approximately $316 per square foot. 302 N 300 E is a home located in Utah County with nearby schools including Mapleton School, Mapleton Junior High School, and Maple Mountain High School.
Ownership History
Date
Name
Owned For
Owner Type
Purchase Details
Closed on
Mar 29, 2012
Sold by
Burton & Norma Nelson Trust and Nelson Norma Jane
Bought by
Lindstrom Kevin J
Current Estimated Value
Purchase Details
Closed on
Jan 26, 2005
Sold by
Nelson Burton L and Nelson Norma H
Bought by
Nelson Burton Levoid and Nelson Norma Jane
Create a Home Valuation Report for This Property
The Home Valuation Report is an in-depth analysis detailing your home's value as well as a comparison with similar homes in the area
Home Values in the Area
Average Home Value in this Area
Purchase History
| Date | Buyer | Sale Price | Title Company |
|---|---|---|---|
| Lindstrom Kevin J | -- | Provo Land Title Co | |
| Nelson Burton Levoid | -- | -- |
Source: Public Records
Tax History
| Year | Tax Paid | Tax Assessment Tax Assessment Total Assessment is a certain percentage of the fair market value that is determined by local assessors to be the total taxable value of land and additions on the property. | Land | Improvement |
|---|---|---|---|---|
| 2025 | $2,483 | $268,070 | -- | -- |
| 2024 | $2,483 | $243,210 | $0 | $0 |
| 2023 | $2,506 | $247,060 | $0 | $0 |
| 2022 | $2,668 | $260,095 | $0 | $0 |
| 2021 | $2,157 | $322,800 | $177,300 | $145,500 |
| 2020 | $2,089 | $302,400 | $156,900 | $145,500 |
| 2019 | $1,875 | $277,000 | $150,500 | $126,500 |
| 2018 | $1,733 | $243,800 | $126,700 | $117,100 |
| 2017 | $1,625 | $121,330 | $0 | $0 |
| 2016 | $1,478 | $109,670 | $0 | $0 |
| 2015 | $1,398 | $103,125 | $0 | $0 |
| 2014 | $1,394 | $100,980 | $0 | $0 |
Source: Public Records
Map
Nearby Homes
Your Personal Tour Guide
Ask me questions while you tour the home.