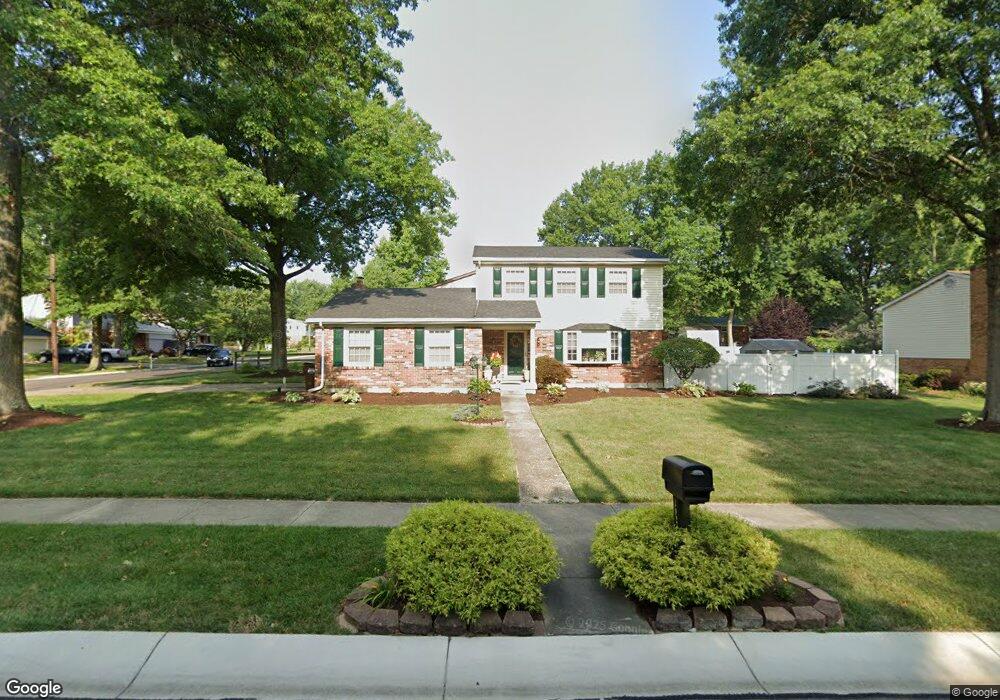
3028 Montezuma Dr Cincinnati, OH 45251
Estimated Value: $241,841 - $282,000
3
Beds
3
Baths
1,560
Sq Ft
$166/Sq Ft
Est. Value
About This Home
This home is located at 3028 Montezuma Dr, Cincinnati, OH 45251 and is currently estimated at $258,710, approximately $165 per square foot. 3028 Montezuma Dr is a home located in Hamilton County with nearby schools including Colerain Elementary School, Colerain Middle School, and Colerain High School.
Ownership History
Date
Name
Owned For
Owner Type
Purchase Details
Closed on
Mar 15, 2021
Sold by
Butler Nicole D
Bought by
Chapman Kathleen W
Current Estimated Value
Purchase Details
Closed on
Dec 31, 2004
Sold by
Watson Rickie W and Watson Melinda Sterling
Bought by
Chapman Kathleen W
Purchase Details
Closed on
Feb 26, 2003
Sold by
William Marsh Gary and William Deborah
Bought by
Watson Rickie W
Home Financials for this Owner
Home Financials are based on the most recent Mortgage that was taken out on this home.
Original Mortgage
$126,000
Interest Rate
6%
Create a Home Valuation Report for This Property
The Home Valuation Report is an in-depth analysis detailing your home's value as well as a comparison with similar homes in the area
Home Values in the Area
Average Home Value in this Area
Purchase History
We collect this data history from publicly available records. To have your information removed, we recommend requesting removal directly through your county’s website.
| Date | Buyer | Sale Price | Title Company |
|---|---|---|---|
| Chapman Kathleen W | -- | -- | |
| Chapman Kathleen W | $150,000 | -- | |
| Watson Rickie W | $140,000 | -- |
Source: Public Records
Mortgage History
We collect this data history from publicly available records. To have your information removed, we recommend requesting removal directly through your county’s website.
| Date | Status | Borrower | Loan Amount |
|---|---|---|---|
| Previous Owner | Watson Rickie W | $126,000 |
Source: Public Records
Tax History
| Year | Tax Paid | Tax Assessment Tax Assessment Total Assessment is a certain percentage of the fair market value that is determined by local assessors to be the total taxable value of land and additions on the property. | Land | Improvement |
|---|---|---|---|---|
| 2025 | $3,980 | $69,062 | $9,702 | $59,360 |
| 2024 | $3,690 | $69,062 | $9,702 | $59,360 |
| 2023 | $3,215 | $69,062 | $9,702 | $59,360 |
| 2022 | $2,380 | $44,884 | $7,581 | $37,303 |
| 2021 | $2,349 | $44,884 | $7,581 | $37,303 |
| 2020 | $2,387 | $44,884 | $7,581 | $37,303 |
| 2019 | $2,071 | $38,038 | $6,426 | $31,612 |
| 2018 | $1,858 | $38,038 | $6,426 | $31,612 |
| 2017 | $1,753 | $38,038 | $6,426 | $31,612 |
| 2016 | $2,041 | $42,501 | $8,855 | $33,646 |
| 2015 | $2,069 | $42,501 | $8,855 | $33,646 |
| 2014 | $2,073 | $42,501 | $8,855 | $33,646 |
| 2013 | $2,708 | $46,197 | $9,625 | $36,572 |
Source: Public Records
Map
Nearby Homes
- 9004 Tripoli Dr
- 2700 Compton Rd
- 9161 Trelawney Ct
- 8613 Noelle Dr
- 2806 Sovereign Dr
- 3069 Sovereign Dr
- 8628 Paisley Dr
- 2978 Regal Ln
- 8524 Noelle Dr
- 8545 Noelle Dr
- 2930 Aries Ct
- 3080 Aries Ct
- 2974 Libra Ln
- 9310 Loralinda Dr
- 8707 Moonlight Ln
- 8456 Jackies Dr
- 2934 Windsong Dr
- 2866 Windsong Dr
- 3204 Pebblebrook Ln Unit 63
- 9287 Coogan Dr
- 3021 Montezuma Dr
- 3025 Montezuma Dr
- 3017 Montezuma Dr
- 3013 Montezuma Dr
- 3031 Montezuma Dr
- 3007 Montezuma Dr
- 3020 Montezuma Dr
- 3035 Montezuma Dr
- 3016 Montezuma Dr
- 3012 Montezuma Dr
- 3003 Montezuma Dr
- 3052 Montezuma Dr
- 3006 Montezuma Dr
- 3039 Montezuma Dr
- 3043 Montezuma Dr
- 2999 Montezuma Dr
- 3002 Montezuma Dr
- 3056 Montezuma Dr
- 3049 Montezuma Dr
- 8916 Renetta Ct
Your Personal Tour Guide
Ask me questions while you tour the home.