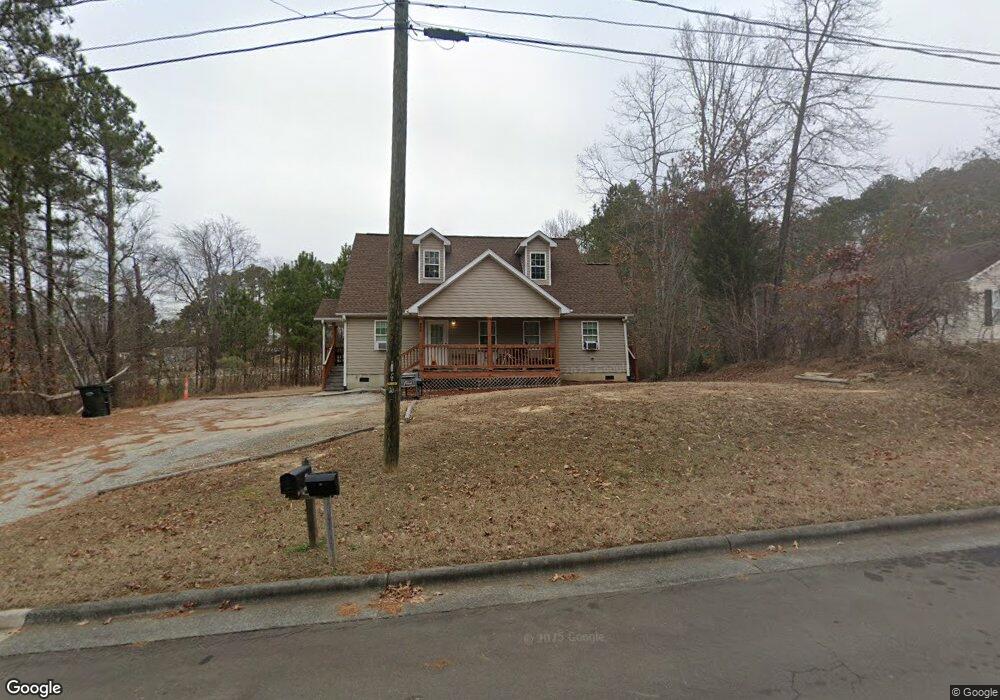
303 Pearson Dr Unit 90 Durham, NC 27713
Woodcroft NeighborhoodEstimated Value: $425,000 - $468,000
3
Beds
3
Baths
1,705
Sq Ft
$264/Sq Ft
Est. Value
About This Home
This home is located at 303 Pearson Dr Unit 90, Durham, NC 27713 and is currently estimated at $449,719, approximately $263 per square foot. 303 Pearson Dr Unit 90 is a home located in Durham County with nearby schools including Southwest Elementary School, Morehead Montessori, and Sherwood Githens Middle.
Ownership History
Date
Name
Owned For
Owner Type
Purchase Details
Closed on
Jun 9, 2020
Sold by
Richardson Marianne Kim
Bought by
Richardson Marianne Kim and Richardson Steven Leonard
Current Estimated Value
Purchase Details
Closed on
Apr 6, 2016
Sold by
North Carolina Housing
Bought by
Richardson Marianne
Home Financials for this Owner
Home Financials are based on the most recent Mortgage that was taken out on this home.
Original Mortgage
$156,800
Outstanding Balance
$122,781
Interest Rate
3.25%
Mortgage Type
New Conventional
Estimated Equity
$326,938
Purchase Details
Closed on
Jul 6, 2015
Sold by
Taylor Ivory L and Taylor Estella C
Bought by
North Carolina Housing And Construction
Home Financials for this Owner
Home Financials are based on the most recent Mortgage that was taken out on this home.
Original Mortgage
$94,320
Interest Rate
3.89%
Mortgage Type
Future Advance Clause Open End Mortgage
Create a Home Valuation Report for This Property
The Home Valuation Report is an in-depth analysis detailing your home's value as well as a comparison with similar homes in the area
Home Values in the Area
Average Home Value in this Area
Purchase History
We collect this data history from publicly available records. To have your information removed, we recommend requesting removal directly through your county’s website.
| Date | Buyer | Sale Price | Title Company |
|---|---|---|---|
| Richardson Marianne Kim | -- | None Available | |
| Richardson Marianne | $196,000 | -- | |
| North Carolina Housing And Construction | $20,000 | Attorney |
Source: Public Records
Mortgage History
We collect this data history from publicly available records. To have your information removed, we recommend requesting removal directly through your county’s website.
| Date | Status | Borrower | Loan Amount |
|---|---|---|---|
| Open | Richardson Marianne | $156,800 | |
| Previous Owner | North Carolina Housing And Construction | $94,320 |
Source: Public Records
Tax History
| Year | Tax Paid | Tax Assessment Tax Assessment Total Assessment is a certain percentage of the fair market value that is determined by local assessors to be the total taxable value of land and additions on the property. | Land | Improvement |
|---|---|---|---|---|
| 2025 | $4,700 | $474,115 | $135,975 | $338,140 |
| 2024 | $2,482 | $177,926 | $36,650 | $141,276 |
| 2023 | $2,331 | $177,926 | $36,650 | $141,276 |
| 2022 | $2,277 | $177,926 | $36,650 | $141,276 |
| 2021 | $2,267 | $177,926 | $36,650 | $141,276 |
| 2020 | $2,213 | $177,926 | $36,650 | $141,276 |
| 2019 | $2,213 | $177,926 | $36,650 | $141,276 |
| 2018 | $2,184 | $161,027 | $43,980 | $117,047 |
| 2017 | $2,168 | $161,027 | $43,980 | $117,047 |
| 2016 | $572 | $43,980 | $43,980 | $0 |
| 2015 | $526 | $38,017 | $38,017 | $0 |
| 2014 | -- | $38,017 | $38,017 | $0 |
Source: Public Records
Map
Nearby Homes
- 900 Spring Meadow Dr
- 4822 Bay Point Dr
- 4824 Bay Point Dr
- 1615 Cultivar Ln
- 427 Hanson Rd
- 816 Hanson Rd
- 1063 Shoreside Dr
- 213 Rosaline Ln
- 1540 Brown St
- 1533 Brown St
- 1032 Shoreside Dr
- 4416 Dolwick Dr
- 100 Stratford Lakes Dr Unit 361
- 100 Stratford Lakes Dr Unit 261
- 100 Stratford Lakes Dr Unit 384
- 100 Stratford Lakes Dr Unit 262
- 100 Stratford Lakes Dr Unit 129
- 4419 Nightfall Ct
- 1017 Searstone Ct
- 4408 Nightfall Ct
- 309 Pearson Dr
- 303 Pearson Dr
- 4815 Bay Point Dr
- 319 Pearson Dr
- 308 Pearson Dr
- 304 Pearson Dr
- 4811 Bay Point Dr
- 316 Pearson Dr
- 302 Pearson Dr
- 4820 Bay Point Dr
- 4915 Mimosa Dr
- Lot 424 Mimosa Dr
- 405 Mimosa Dr
- LOT 11 Mimosa Dr
- 5034 Mimosa Dr
- 419 Mimosa Dr
- 4915 Mimosa Dr Unit 409
- 4902 Mimosa Dr
- 4920 Mimosa Dr
- 5016 Mimosa Dr
Your Personal Tour Guide
Ask me questions while you tour the home.