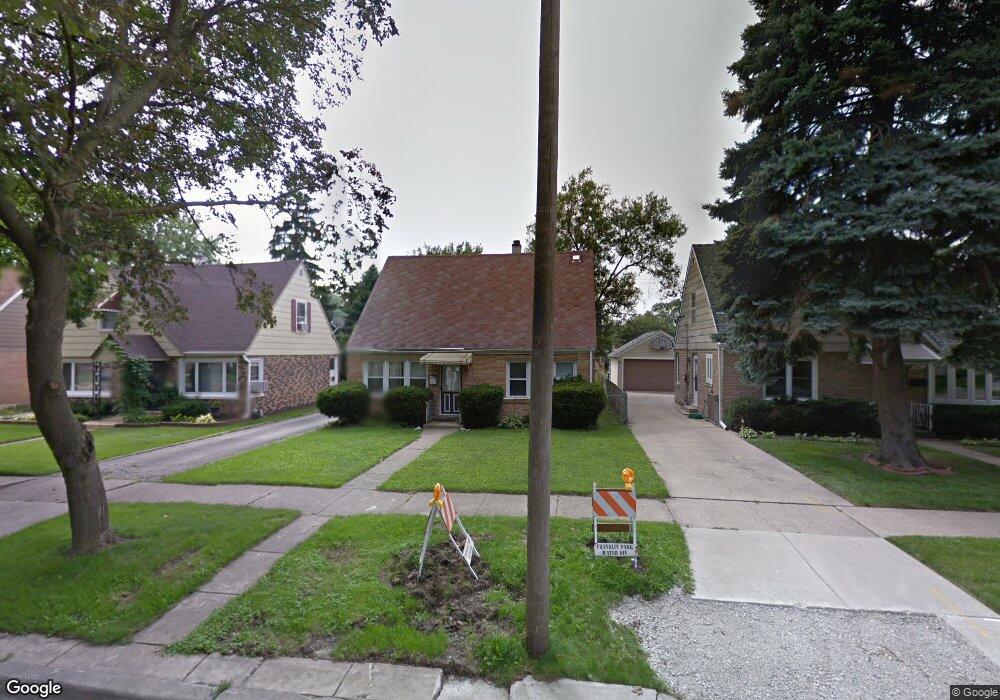
3038 Sunset Ln Franklin Park, IL 60131
Estimated Value: $288,341 - $345,000
2
Beds
1
Bath
868
Sq Ft
$364/Sq Ft
Est. Value
About This Home
This home is located at 3038 Sunset Ln, Franklin Park, IL 60131 and is currently estimated at $315,835, approximately $363 per square foot. 3038 Sunset Ln is a home located in Cook County with nearby schools including Roy Elementary School, Mannheim Middle School, and West Leyden High School.
Ownership History
Date
Name
Owned For
Owner Type
Purchase Details
Closed on
Jun 18, 2003
Sold by
Angel Betty A and Angel Jennifer C
Bought by
Angel Betty A
Current Estimated Value
Purchase Details
Closed on
Aug 29, 1996
Sold by
Raymond Richard J and Raymond Melody M
Bought by
Angel Betty A and Angel Jennifer C
Home Financials for this Owner
Home Financials are based on the most recent Mortgage that was taken out on this home.
Original Mortgage
$116,800
Outstanding Balance
$6,820
Interest Rate
8.27%
Mortgage Type
FHA
Estimated Equity
$309,015
Create a Home Valuation Report for This Property
The Home Valuation Report is an in-depth analysis detailing your home's value as well as a comparison with similar homes in the area
Home Values in the Area
Average Home Value in this Area
Purchase History
| Date | Buyer | Sale Price | Title Company |
|---|---|---|---|
| Angel Betty A | -- | -- | |
| Angel Betty A | $118,000 | -- |
Source: Public Records
Mortgage History
| Date | Status | Borrower | Loan Amount |
|---|---|---|---|
| Open | Angel Betty A | $116,800 |
Source: Public Records
Tax History
| Year | Tax Paid | Tax Assessment Tax Assessment Total Assessment is a certain percentage of the fair market value that is determined by local assessors to be the total taxable value of land and additions on the property. | Land | Improvement |
|---|---|---|---|---|
| 2025 | $5,505 | $24,000 | $6,274 | $17,726 |
| 2024 | $5,505 | $23,000 | $5,134 | $17,866 |
| 2023 | $3,138 | $23,000 | $5,134 | $17,866 |
| 2022 | $3,138 | $23,000 | $5,134 | $17,866 |
| 2021 | $4,939 | $16,259 | $3,707 | $12,552 |
| 2020 | $4,984 | $16,259 | $3,707 | $12,552 |
| 2019 | $5,223 | $18,372 | $3,707 | $14,665 |
| 2018 | $5,075 | $16,286 | $3,137 | $13,149 |
| 2017 | $5,072 | $16,286 | $3,137 | $13,149 |
| 2016 | $5,069 | $16,286 | $3,137 | $13,149 |
| 2015 | $4,913 | $15,269 | $2,852 | $12,417 |
| 2014 | $4,838 | $15,269 | $2,852 | $12,417 |
| 2013 | $4,630 | $15,269 | $2,852 | $12,417 |
Source: Public Records
Map
Nearby Homes
- 3106 Sunset Ln
- 10101 Belmont Ave
- 3239 Sarah St
- 3013 Lincoln St
- 3005 Lincoln St
- 3108 Lincoln St
- 2843 Hawthorne St
- 10729 W Grand Ave
- 3422 Elder Ln
- 2634 Silver Creek Dr
- 9670 Franklin Ave Unit 508
- 10129 Westmanor Dr
- 9822 Richard Ave
- 9741 Lonnquist Dr
- 3044 Rose St
- 3529 George St
- 3427 Lonnquist Dr
- 2609 Elder Ln
- 3541 Emerson St
- 2522 Westbrook Dr
Your Personal Tour Guide
Ask me questions while you tour the home.