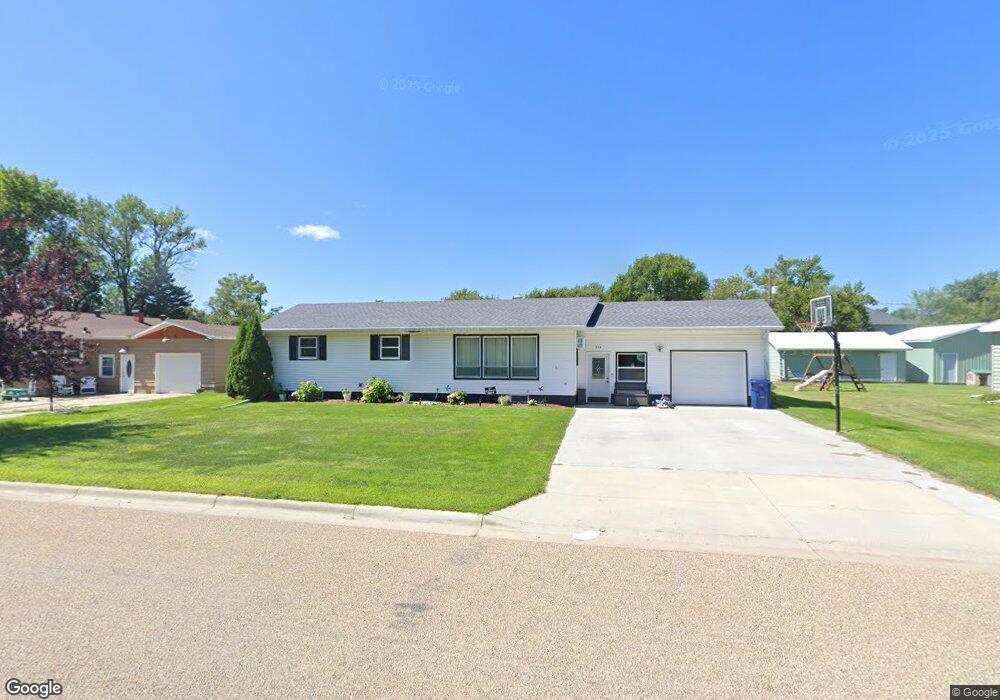
304 3rd St Wyndmere, ND 58081
Estimated Value: $135,000 - $149,000
3
Beds
--
Bath
1,192
Sq Ft
$120/Sq Ft
Est. Value
About This Home
This home is located at 304 3rd St, Wyndmere, ND 58081 and is currently estimated at $142,631, approximately $119 per square foot. 304 3rd St is a home with nearby schools including Wyndmere Elementary School and Wyndmere High School.
Ownership History
Date
Name
Owned For
Owner Type
Purchase Details
Closed on
Jul 30, 2020
Sold by
Frank Brandon L and Frank Elva I
Bought by
Frank Brandon L and Frank Elva I
Current Estimated Value
Home Financials for this Owner
Home Financials are based on the most recent Mortgage that was taken out on this home.
Original Mortgage
$79,690
Outstanding Balance
$56,710
Interest Rate
3.1%
Mortgage Type
FHA
Estimated Equity
$85,921
Purchase Details
Closed on
Aug 31, 2007
Sold by
Foyt Fern
Bought by
Frank Brandon L
Home Financials for this Owner
Home Financials are based on the most recent Mortgage that was taken out on this home.
Original Mortgage
$50,490
Interest Rate
6.71%
Mortgage Type
New Conventional
Create a Home Valuation Report for This Property
The Home Valuation Report is an in-depth analysis detailing your home's value as well as a comparison with similar homes in the area
Purchase History
| Date | Buyer | Sale Price | Title Company |
|---|---|---|---|
| Frank Brandon L | -- | Innovative Abstract & Ttl Co | |
| Frank Brandon L | $49,500 | Trn Abstract & Title Richlan |
Source: Public Records
Mortgage History
| Date | Status | Borrower | Loan Amount |
|---|---|---|---|
| Open | Frank Brandon L | $79,690 | |
| Closed | Frank Brandon L | $50,490 |
Source: Public Records
Tax History
| Year | Tax Paid | Tax Assessment Tax Assessment Total Assessment is a certain percentage of the fair market value that is determined by local assessors to be the total taxable value of land and additions on the property. | Land | Improvement |
|---|---|---|---|---|
| 2024 | $1,488 | $55,550 | $2,800 | $52,750 |
| 2023 | $1,351 | $52,300 | $2,800 | $49,500 |
| 2022 | $1,141 | $45,000 | $2,800 | $42,200 |
| 2021 | $1,544 | $42,000 | $2,300 | $39,700 |
| 2020 | $1,520 | $40,300 | $2,150 | $38,150 |
| 2019 | $1,534 | $40,300 | $2,150 | $38,150 |
| 2018 | $1,525 | $38,000 | $1,450 | $36,550 |
| 2017 | $1,537 | $33,850 | $1,350 | $32,500 |
| 2016 | $790 | $33,850 | $1,350 | $32,500 |
| 2015 | -- | $3,047 | $0 | $0 |
| 2014 | -- | $3,047 | $0 | $0 |
| 2013 | -- | $3,047 | $0 | $0 |
Source: Public Records
Map
Nearby Homes
Your Personal Tour Guide
Ask me questions while you tour the home.