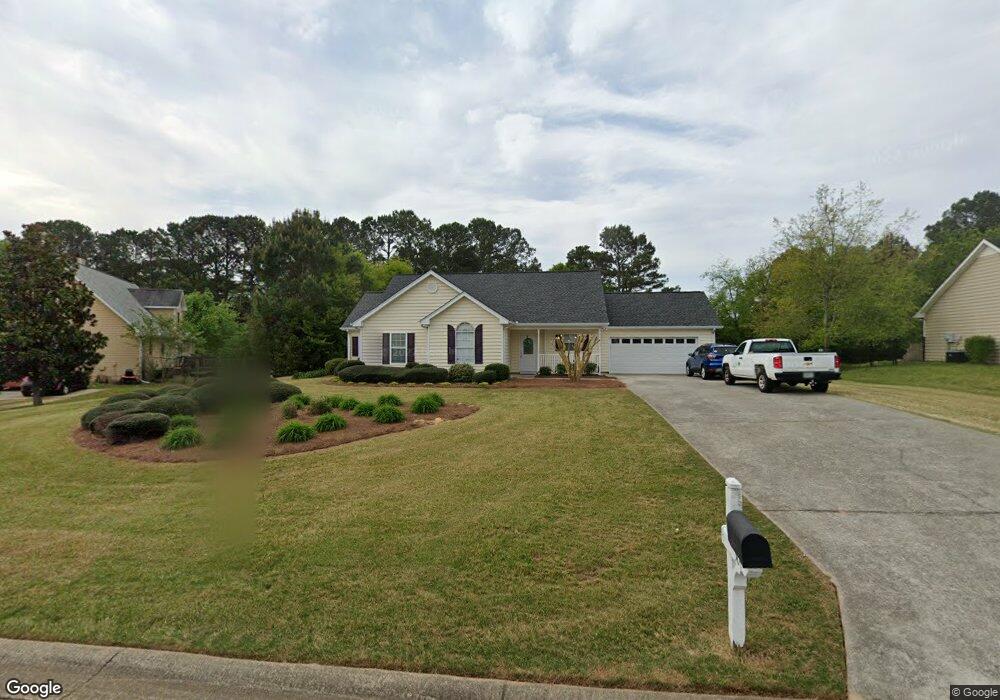
304 Ron Dr Unit 2 Bethlehem, GA 30620
Estimated Value: $307,000 - $330,000
3
Beds
2
Baths
1,562
Sq Ft
$207/Sq Ft
Est. Value
About This Home
This home is located at 304 Ron Dr Unit 2, Bethlehem, GA 30620 and is currently estimated at $322,716, approximately $206 per square foot. 304 Ron Dr Unit 2 is a home located in Barrow County with nearby schools including Yargo Elementary School, Haymon-Morris Middle School, and Apalachee High School.
Ownership History
Date
Name
Owned For
Owner Type
Purchase Details
Closed on
Mar 22, 2002
Sold by
Hud
Bought by
Freeman Robert R and Freeman Mary
Current Estimated Value
Home Financials for this Owner
Home Financials are based on the most recent Mortgage that was taken out on this home.
Original Mortgage
$86,400
Outstanding Balance
$34,462
Interest Rate
6.85%
Mortgage Type
New Conventional
Estimated Equity
$288,254
Purchase Details
Closed on
Dec 4, 2001
Sold by
Bancorpsouth Bank
Bought by
Secretary Of The
Purchase Details
Closed on
Sep 30, 1999
Sold by
Hickson Jane
Bought by
Meineker Mary Jo
Home Financials for this Owner
Home Financials are based on the most recent Mortgage that was taken out on this home.
Original Mortgage
$108,950
Interest Rate
7.89%
Mortgage Type
FHA
Purchase Details
Closed on
Nov 3, 1998
Sold by
New South Home Builders Inc
Bought by
Main Street Bank
Purchase Details
Closed on
Feb 24, 1998
Sold by
Cgs Develop
Bought by
New South Home Builders
Home Financials for this Owner
Home Financials are based on the most recent Mortgage that was taken out on this home.
Original Mortgage
$86,320
Interest Rate
10%
Mortgage Type
New Conventional
Create a Home Valuation Report for This Property
The Home Valuation Report is an in-depth analysis detailing your home's value as well as a comparison with similar homes in the area
Home Values in the Area
Average Home Value in this Area
Purchase History
We collect this data history from publicly available records. To have your information removed, we recommend requesting removal directly through your county’s website.
| Date | Buyer | Sale Price | Title Company |
|---|---|---|---|
| Freeman Robert R | -- | -- | |
| Secretary Of The | -- | -- | |
| Meineker Mary Jo | $109,000 | -- | |
| Main Street Bank | -- | -- | |
| New South Home Builders | $19,000 | -- |
Source: Public Records
Mortgage History
We collect this data history from publicly available records. To have your information removed, we recommend requesting removal directly through your county’s website.
| Date | Status | Borrower | Loan Amount |
|---|---|---|---|
| Open | Freeman Robert R | $86,400 | |
| Previous Owner | Meineker Mary Jo | $108,950 | |
| Previous Owner | New South Home Builders | $86,320 |
Source: Public Records
Tax History
| Year | Tax Paid | Tax Assessment Tax Assessment Total Assessment is a certain percentage of the fair market value that is determined by local assessors to be the total taxable value of land and additions on the property. | Land | Improvement |
|---|---|---|---|---|
| 2025 | $2,529 | $104,696 | $26,800 | $77,896 |
| 2024 | $2,578 | $102,435 | $26,800 | $75,635 |
| 2023 | $2,579 | $102,835 | $26,800 | $76,035 |
| 2022 | $2,307 | $78,854 | $22,400 | $56,454 |
| 2021 | $2,246 | $72,454 | $16,000 | $56,454 |
| 2020 | $1,847 | $58,924 | $16,000 | $42,924 |
| 2019 | $1,879 | $58,924 | $16,000 | $42,924 |
| 2018 | $1,773 | $56,124 | $13,200 | $42,924 |
| 2017 | $1,442 | $49,542 | $13,200 | $36,342 |
| 2016 | $1,386 | $43,803 | $13,200 | $30,603 |
| 2015 | $1,403 | $44,154 | $13,200 | $30,954 |
| 2014 | $1,249 | $37,774 | $6,468 | $31,306 |
| 2013 | -- | $35,936 | $6,468 | $29,468 |
Source: Public Records
Map
Nearby Homes
- 204 Angie Way Unit 2
- 1442 Dillard Heights Dr
- 1256 Loganville Hwy
- 1129 Loganville Hwy
- 1007 Preserve Ln
- 1029 Preserve Ln
- 907 Downing Dr
- 915 Downing Dr
- 924 Downing Dr
- 722 Ridgetop Rd
- 925 Nature Trail Unit 2
- 1159 Nantucket Way
- 509 Bentley Cir
- 1250 Persimmon Place Dr
- 925 Downing Dr
- 543 Saddle Ridge Dr
- 189 Marie Ct
- 649 Tanners Bridge Rd
- 1188 Carl-Bethlehem Rd
- 320 Lokeys Ln
- 306 Ron Dr Unit 2
- 302 Ron Dr
- 308 Ron Dr Unit 2
- 0 Stonewilde at Turnberr Unit 3173599
- 792 Brookelynn Trace
- 792 Brookelynn Trace Unit 38
- 792 Brookelyn Trace
- 305 Ron Dr
- 407 Lokeys Ridge Rd Unit 52A
- 407 Lokeys Ridge Rd
- 301 Ron Dr
- 310 Ron Dr Unit 2
- 307 Ron Dr Unit 2
- 403 Lokeys Ridge Rd
- 409 Lokeys Ridge Rd
- 790 Brookelyn Trace
- 405 Lokeys Ridge Rd
- 407 Lokey's Ridge Rd
- 403 Lokey's Ridge Rd Unit 50A
- 401 Lokeys Ridge Rd
Your Personal Tour Guide
Ask me questions while you tour the home.